
June 2024 quarter ASX A-REIT market update
Stuart Cartledge, Managing Director, Phoenix Portfolios
Market Commentary
The S&P/ASX 300 A-REIT Accumulation Index gave up some of its first quarter gains, falling 5.7% in the June quarter. Property stocks underperformed broader equities in the quarter, with the S&P/ASX 300 Accumulation Index losing a lessor 1.2%. Stronger than expected inflation figures led market participants to believe that any expected interest rate cuts by the Reserve Bank of Australia would be delayed, or that the next change in interest rates may even be a move higher.
Property fund managers saw quite divergent performance across the quarter. Goodman Group (GMG) led the way, rising 3.2%, significantly outperforming the broader property sector. GMG’s ongoing outperformance is leading to the unusual situation in which it now accounts for almost 40% of the entire property index. The impact on benchmark returns is clear, with the median property stock in the index down 8.6%, significantly more than the reported 5.7%. Centuria Capital Group (CNI) was also an outperformer in the period, giving up only 2.9%. Alternatively, each of Charter Hall Group (CHC), Elanor Investors Group (ENN) and Qualitas Limited (QAL), meaningfully underperformed, falling 17.0%, 14.4% and 10.6% respectively.
Office property owners were underperformers in the June quarter, as transactional evidence began to filter through after a dearth of transactions in recent periods. Dexus (DXS) reported the $296.2 million sale of 50% of 5 Martin Place, a somewhat new, A grade building in the heart of Martin Place in the Sydney CBD, at an implied capitalisation rate of above 6.1%. DXS also sold B grade asset, 130 George Street in Parramatta for $69.1 million at an implied capitalisation rate greater than 10% and more than 30% below its prior book value. Whilst this sale faced some asset specific concerns and Parramatta is a weaker submarket, the transaction reflects a challenging market for secondary office assets. DXS finished the quarter down 15.4%. Mirvac Group (MGR) pleasingly announced the unconditional exchange of a 66% interest in its 55 Pitt Street office development project, with an end value of approximately $2 billion, highlighting some demand for prime office investments. MGR also announced it had delivered on previously announced sales, including 367 Collins Street in the Melbourne CBD, which faced some prior delays. MGR was down 18.2% on the quarter. Centuria Office REIT (COF) was also weak, losing 15.0%, as was Growthpoint Properties Australia (GOZ), off 10.8%.
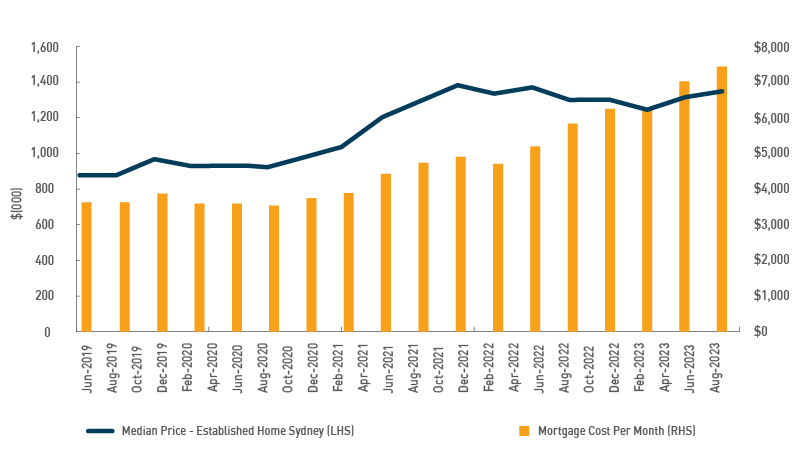
Residential property developers delivered mixed performance during the period, with the prospect of delayed interest rate cuts fighting against an ongoing supply/demand imbalance. There has been significant divergence in home price performance and new home sales across the country. After underperforming for many years, Perth has seen median dwelling price growth of more than 23% year over year, with some growth corridors significantly outpacing that number. Perth-based residential developers outperformed, with Finbar Group Limited (FRI) moving 21.7% higher and Peet Limited (PPC) up 0.4%. Melbourne has been significantly weaker, with new home and land sales falling meaningfully. The median dwelling value in Brisbane is now almost 10% above Melbourne and both Adelaide and Perth median dwelling values are within 3.5% of Melbourne. AV Jennings Limited (AVJ) has meaningful exposure to the Australian East Coast and dropped 19.7%. Stockland (SGP) was also a weak performer, giving up 10.6%.
Shopping Centre owners were also weak performers during the period, as consumer confidence and retail sales are beginning to show signs of fading. Some retailers including Mosaic Brands and KMD Brands (owner of Kathmandu), provided updates suggesting that conditions had been challenging in recent periods. Vicinity Centres (VCX) was a meaningful underperformer, off 13.1%, whilst Scentre Group (SCG) dropped 8.0%. Owners of smaller centres were not spared, with Charter Hall Retail REIT losing 12.4% and Region Group (RGN) finishing the quarter 9.2% lower.


 Cromwell’s Investment Manager, Lachlan Stewart, is an experienced commercial real estate professional, who has spent more than 20 years working for highly respected organisations, including Colliers International and GE Capital Real Estate. He specialises in property valuations and financial modelling.


 About Stuart Cartledge


 The quarter started off on positive footing, with inflation across advanced economies edging down to 4.4% YoY in July1. Central Banks’ continued focus on inflation outcomes saw data moderate, helping to ease pressure on rates. However toward the quarter’s end, it was rising energy prices (in part driven by a supply halt by OPEC+) which posed some risk to the inflation outlook and therefore increasing interest rate expectations once again
 While expectations of further cash rate hikes have diminished, longer term interest rates (proxied by 10-year bond yields) remain ~40bps higher than a year ago4. This is continuing to put pressure on debt costs and is the main macro driver challenging property valuations, despite resilience across demand drivers.
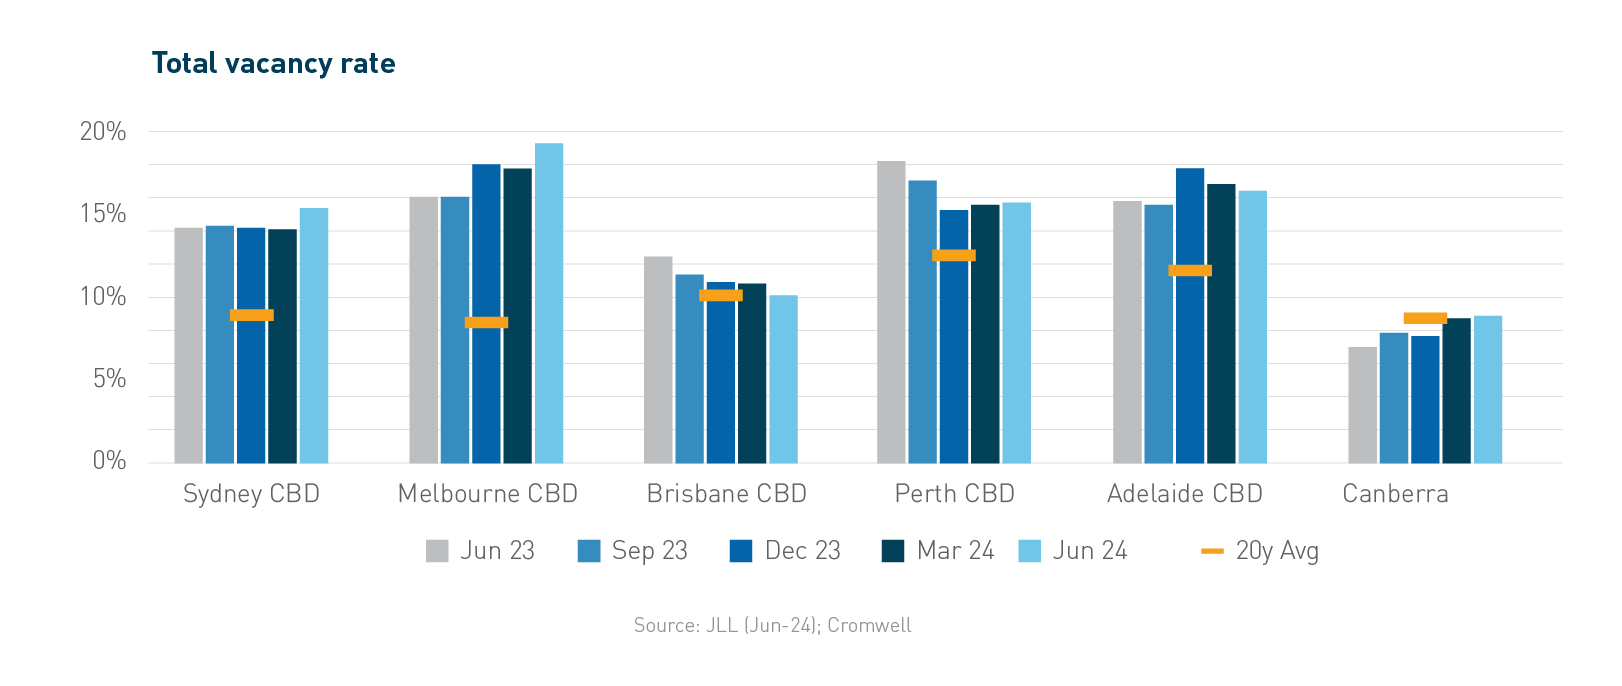
 There continues to be mixed demand readings between the major CBDs, largely aligned to the different industry compositions of the markets. According to JLL Research, national CBD net absorption totalled around 1.5k square metres (sqm) across the quarter. The resource-based markets of Brisbane and Perth both continued their run of positive demand, which has now extended to over a year for each. Adelaide recorded the strongest CBD result with positive net absorption of 37.5k sqm, underpinned by the completion of a 40k sqm Prime office building at 60 King William St anchored by Services Australia. Sydney CBD recorded the weakest result on a quarterly and annual basis, with all precincts except the Core contracting over 3Q23. Prime net absorption was stronger than Secondary net absorption for the tenth consecutive quarter, with Sydney and Canberra the only CBD markets recording weaker net absorption across Prime stock.

 The impact of higher interest rates is being felt by consumers, with retail sales rising by a modest 0.7% over July and August combined. This was despite positive effects from warmer than normal weather and the Women’s World Cup boosting clothing and dining spending. Annual growth has slowed to 1.5% and with population growth running above 2%, real growth per capita is firmly in negative territory. On an annual basis, dining continues to record the strongest growth, followed by groceries. Tasmania is the worst performing market with nominal sales heading backwards year-on-year, while the ACT has been the top performer with annual sales growth of 5.5%.