Person typing on a laptop

Learn

July 18, 2023

Ignore the noise: Australian office isn’t dead (or dying)

Colin Mackay


sydney-harbour

The future of offices in a post-pandemic world continues to be a topic of robust conversation.

Arguably, most airtime on the subject has been given to dramatic statements like “expect the death of the office” – perhaps recycling articles from the past decade that incorrectly asserted a retail apocalypse was nigh! The reality is that, as retail has adapted to the internet age – and survived – so too will office spaces adapt to these changing conditions.

It can be easy to fear the worst, especially as reports of landlords handing keys to the bank; assets sitting unoccupied; and valuations declining 80% take up the front page of newspapers.

It’s important, however, to understand that these events have been limited to the US, a challenged market with different financial, social, and real estate context. The outlook for office in Australia is markedly more positive for several reasons.


Higher office occupancy

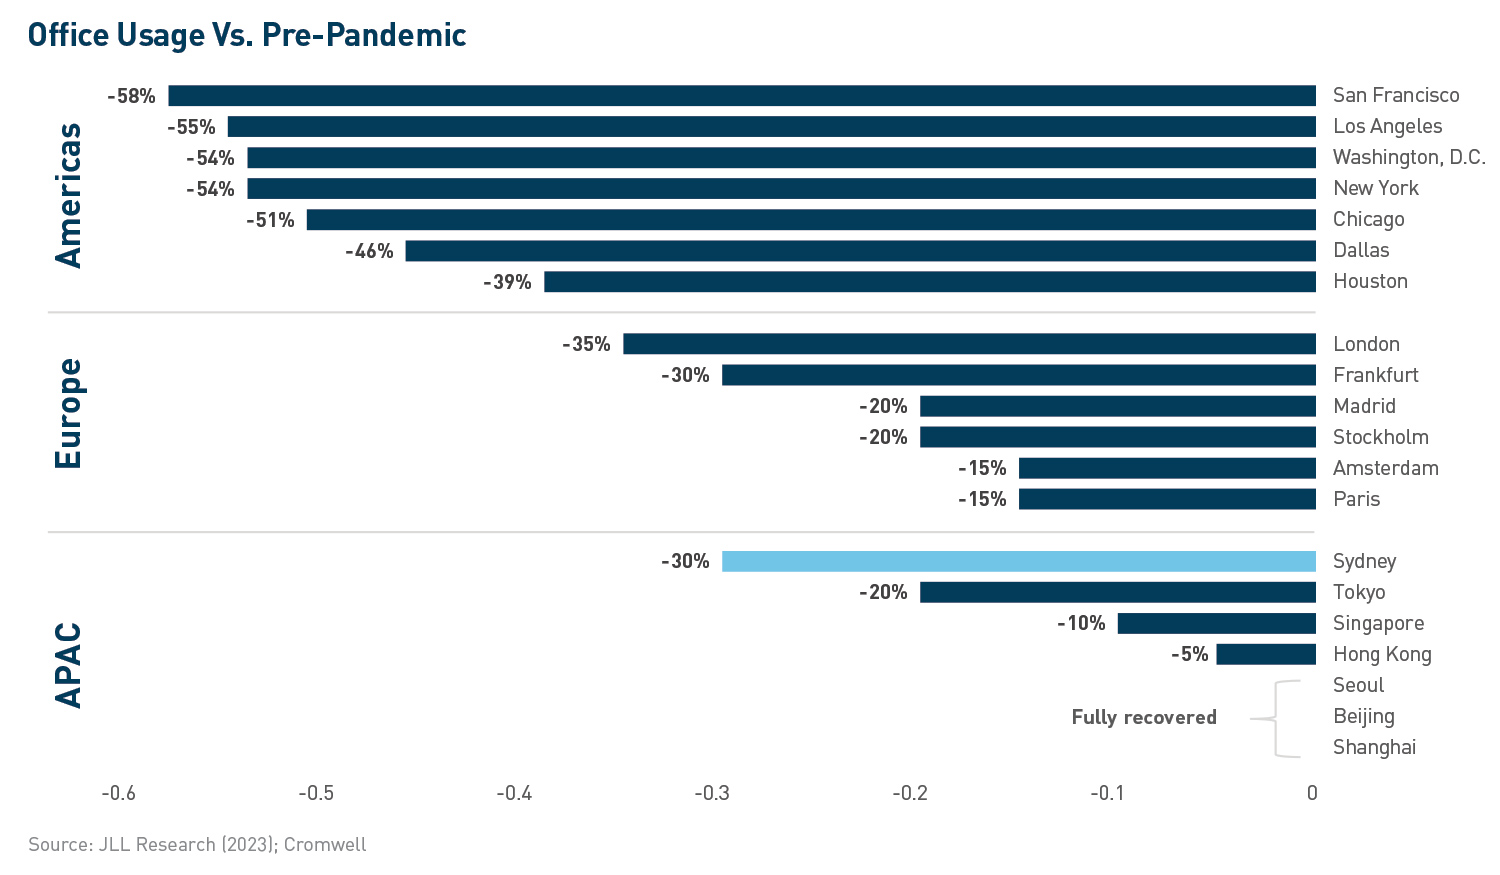
The return to the office has been strongest in Asia-Pacific, where office occupancy is sitting at 70-100% of pre-pandemic levels1. Workers in North America have been the most reluctant to come back to CBDs (45-65%), with Europe (65-85%) splitting the two regions. At the individual market level, the likes of Shanghai and Beijing are back at pre-pandemic occupancy; Sydney has recovered to 70%; London is a bit weaker at 65%; and the major US cities are significant laggards with office-based work still below half of pre-pandemic levels in Chicago (49%), New York (46%), and San Francisco (42%).

graph_officeusage

Propensity to return to the office appears to be driven by a number of factors, including cultural expectations (e.g., Tokyo/Seoul); industry composition (e.g., finance vs tech); and ease of commute (e.g., rapid transit vs LA traffic). While commute time is highlighted by workers around the globe as the most important driver of returning to the office2, another critical factor is the micro-location of each office building. In addition to influencing commute time, different locations can vary significantly in terms of crime and safety risks, amenity (e.g., restaurants), and environmental desirability (e.g., proximity to water/green spaces).

Australia measures up very attractively on these characteristics, offering reliable rapid transit, exceptional proximity to desirable environmental features, a high density of quality amenity integrated throughout the CBDs, and very low rates of crime. The return to the office will likely gather more steam in the coming months as large employers mandate a minimum number of days in the office per week, as announced recently by NAB and CommBank. However, over the long-term, locations and assets which can attract employees through choice rather than coercion will outperform.

/graph_ridershipnumbers

graph_workpointdensity


Expanding space requirements

One of the forces expected to offset the impact of remote work is the expansion of workspace ratios – the amount of office space per employee. Forty years ago, in the days of private offices, Australian offices had more than 20 square metres (sqm) of space per employee. Over time, as occupiers sought more “bang for their buck”, desks became more tightly packed together and the corner office was sent to the scrap heap.

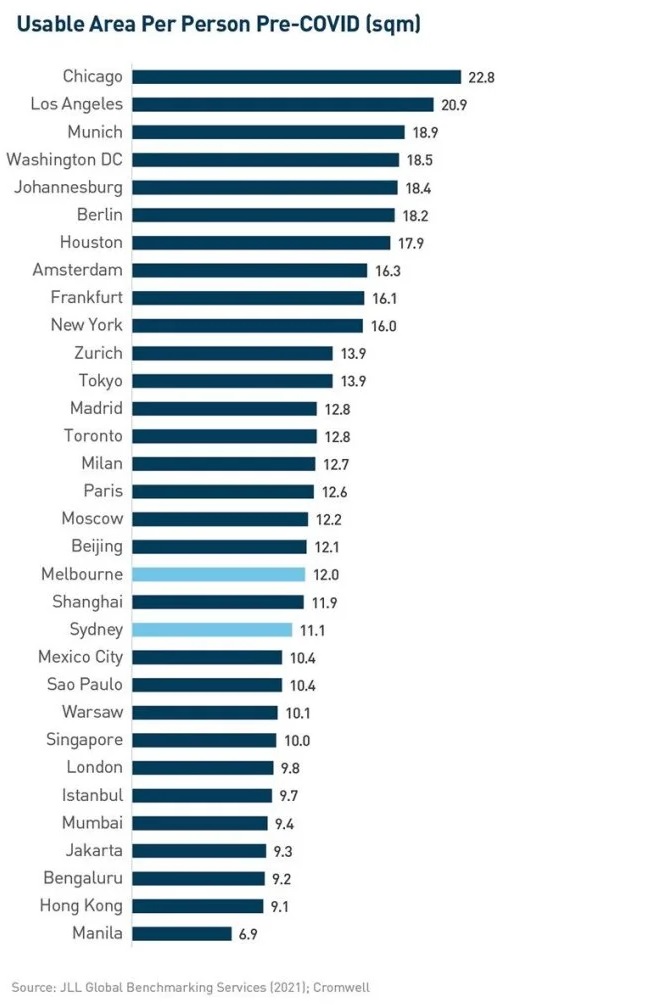
The result has been densification of the workplace, with the pre-COVID workspace ratio sitting at 11.1 sqm per employee for Sydney and 12.0 sqm for Melbourne3.


The experience of the pandemic has initiated a shift in the purpose of the workplace and workstyles. The office is increasingly becoming a place for collaboration and social connection rather than focus work, meaning a greater need for meeting, gathering, and collaboration spaces. There is also a need to lower density and make workplaces more comfortable from an employee wellbeing and retention perspective, as employers fight for top talent. Studies have shown that inadequate privacy and space is the dominant cause of workspace dissatisfaction4.

The office is increasingly becoming a place for collaboration and social connection.


In the US, markets such as Chicago and Los Angeles have ratios above 20 sqm per employee, with even New York at 16.0 sqm3. The pandemic-initiated evolution of the work environment can be achieved in these markets by simply recalibrating (and even shrinking) existing footprints.


Contrast this environment with Australia, where workspace ratios are below the global average of 13.3 sqm3 and potential space efficiencies are limited. In this market, the recalibration will likely require additional space, providing a source of demand and limiting the amount of rent-dampening excess stock.


graph_bankloanexposure

Appropriate financing

Earlier in the year, some high-profile office defaults in the US by Brookfield, and a PIMCO-owned landlord, kicked off concerns about a real estate debt crisis. Risks are certainly elevated in the US, given the aforementioned demand challenges, which will pressure serviceability and put significant downwards pressure on valuations. While pockets of distress may emerge in Australia, the likelihood of a widespread crisis is much lower. Banks remain confident in Australian commercial real estate, increasing their exposure by 5% in December 2022 compared to a year ago5. Loan quality has also remained stable, with non-performing commercial property loans as a share of total exposure unchanged at 0.5%.

Most importantly, the office demand outlook in Australia is much more positive. Solid cashflow will support serviceability as debt rolls onto higher interest rates and help prevent valuations from declining to the extent that is expected in the US. Australia’s lending market is also well regulated, diversified, and strong, and doesn’t face the concentrated exposure or balance sheet issues that smaller regional banks in the US have been contending with throughout 2023.

Additionally, Australian gearing is more conservative with typical loan-to-value (LTV) ratios pre pandemic of 55%, compared to 72% for the US6. While lending conditions have tightened somewhat over the last six months (LTVs now 50%), the US has seen significant tightening (to 57%), contributing to a significant funding gap which will need to be plugged with discount-seeking capital.

The final word

Office is going through a period of change, and assets need to evolve to meet the needs of post pandemic workstyles. While there will be challenges – and opportunities – as a result, the current narrative erroneously extrapolates issues from offshore to the domestic market.


Australian office is well-placed to contend with increased rates of remote working and tighter capital markets given its resilient demand drivers, quality of stock, and sensible financing arrangements. Skilled managers with the expertise to identify underappreciated assets and adapt them to the future of work will continue to deliver strong investment returns.


Footnotes

1 The Future of the Central Business District, May 2023 (JLL)
2 The Global Live-Work-Shop Report, November 2022 (CBRE)
3 Benchmarking Cities and Real Estate, June 2021 (JLL)
4 A data-driven analysis of occupant workspace dissatisfaction, August 2021 (Kent, Parkinson & Kim)
5 Quarterly authorised deposit-taking institution property exposures, December 2022 (APRA)
6 Analysing the Funding Gap: Asia Pacific, May 2023 (JLL)

About our managed commercial property funds

Our suite of funds offers access to unlisted property trusts, ASX-listed Real Estate Investment Trusts and internationally listed small cap securities, providing different methods of investing in commercial property and diversifying your portfolio.

Person typing on a laptop

Learn

July 18, 2023

June 2023 quarter ASX A-REIT market update

Stuart Cartledge, Managing Director, Phoenix Portfolios


AREIT market update

The S&P/ASX 300 A-REIT Accumulation Index moved higher in the June quarter, rising 3.2%. Property stocks reversed recent trends and outperformed broader equities in the quarter, with the S&P/ASX 300 Accumulation Index adding a lessor 1.0%. This outperformance is relatively surprising considering the 10 Year Australian Government Bond yield increased meaningfully over the quarter, finishing at approximately 4.0%.

Many property owners released their valuations as at 30 June. Broadly speaking properties saw expansions in capitalisation rates (cap rates). For industrial property owners, strong market rent growth mostly offset this cap rate expansion, holding valuations close to flat in most cases. Retail and office properties did not hold up as well, with market rents holding relatively steady amidst cap rate expansion. Properties with long weighted average lease expiries (WALEs) and low capitalisation rates saw the biggest declines in values due to their interest rate sensitive nature.

Property fund managers were predominantly outperformers during the quarter. Smaller capitalisation fund managers performed particularly well, with Centuria Capital Group (CNI) up 13.1%, Qualitas Limited (QAL) gaining 12.6% and Elanor Investors Group (ENN) adding 9.3%. Goodman Group (GMG) was also a solid performer, lifting by 7.6%, while Charter Hall Group (CHC) gave up ground, off 0.7%, likely due to its exposure to office property.

Retail property owners were the major underperformers during the quarter. A series of more negative data points came out across the period. Firstly, retail sales figures underperformed expectations. Furthermore, many retailers who provided sales updates during the quarter disappointed investors. Fashion retailer Universal Store Holdings Limited (UNI) severely disappointed and fell almost 40% in May. Larger retailers JB Hi-Fi (JBH) and Super Retail Group (SUL) also had soft performance, declining by more than 10% from intra-period highs. This weak performance of retailers was reflected in the share prices of their landlords. Vicinity Centres (VCX) lost 5.1%, Scentre Group (SCG) gave up 3.6% and offshore property owner Unibail-Rodamco-Westfield finished 3.8% lower. The performance of less discretionary neighbourhood shopping centre owners was not as weak, however still underperformed the broader property market, with Region Group (RGN) and Charter Hall Retail REIT (CQR) off 0.1% and 0.6% respectively.

Office property owners had mixed fortunes in the June quarter. Dexus (DXS) recovered some lost ground in the period, adding 7.0%. In contrast, Centuria Office REIT (COF) lost 1.7% and Growthpoint Properties Australia (GOZ) gave up 5.0%. Direct office transactions have been extremely limited in recent periods, with buyers and sellers appearing to have divergent price expectations. Those properties that have traded have done so at discounts to book value of between 10% and 25%.

Those with exposure to residential development had a very strong period of performance. Mirvac Group (MGR) led the way, up 11.2%, while large capitalisation peer Stockland added 4.9%. Peet Limited was also an outperformer in the quarter, gaining 9.3%. Resilience in residential house prices has been surprising, with developers likely to be supported by high net immigration numbers along with limited supply of new housing.


Market outlook

The listed property sector is in good shape and provides investors with the opportunity to gain exposure to high quality commercial real estate at a meaningful discount to independently assessed values. While share market volatility may be uncomfortable at times, the offset is liquidity, enabling investors to rebalance portfolios without the risk of being trapped in illiquid vehicles. Rising interest rates have been a headwind for many asset classes, with property, both listed and unlisted, a particularly interest rate sensitive sector.

The August reporting season saw a number of listed stocks come under pressure as short term interest rates hedges are beginning to roll off and higher interest costs are impacting earnings growth and distributions. Long term valuations are driven by “normalised” interest costs, meaning the impact of short term hedges maturing is mostly immaterial.

The industrial sub-sector continues to be the most sought after, given the tailwinds of e-commerce growth, the potential onshoring of key manufacturing categories and the decision by many corporates to build some redundancy into supply chains to cope with current disruptions. All of these factors are contributing to ongoing demand for industrial space, which is evident by rapidly accelerating market rents and vacancy rates at historic lows of around 1% in many markets.

We remain cognisant of the structural changes occurring in the retail sector with the growing penetration of online sales and the greater importance of experiential offering inside malls. Recent performance of shopping centre owners has however been strong, with consumers showing resilience. It is interesting to note the juxtaposition of very high retail sales figures despite very low levels of consumer confidence, no doubt impacted by rising costs of living.

Importantly, we are also now seeing positive re-leasing spreads in shopping centres, indicating strengthening demand from retail tenants. The jury is still out on exactly how tenants will use office space moving forward, but demand for good quality well located space remains. Leasing activity is beginning to pick up, and there has also been some transactional activity, albeit at prices typically at discounts to book values.

Incentives on new leases do remain elevated and some vacancy in the market is becoming apparent. We expect to see further downside to asset values in office markets, but elsewhere expect market rent growth to largely offset cap rate expansion, particularly in industrial assets. Listed pricing provides a meaningful buffer to such movements.

About Stuart Cartledge

Stuart is the Managing Director of Phoenix Portfolios and the portfolio manager for each of the company’s property portfolios. Prior to establishing the business in 2006, Stuart built a strong track record in the listed property security asset class and has been actively managing securities portfolios since 1993. Stuart holds a master’s degree in engineering and management from the University of Birmingham and is a Chartered Financial Analyst.

Person typing on a laptop

Learn

July 18, 2023

In conversation with… Lara Young

Lara Young joined Cromwell in January 2023. Lara recently became a fellow of Institute of Environmental Management and Assessment and has been a chartered Environmentalist since 2020.

She was named Young Person of the Year by the Construction Leadership Council (CLC) in 2022, and Energy and Carbon Leader of the Year at the 2021 edie Awards – the United Kingdom’s industry leading sustainability awards –and since 2021 has been the Chair of the Carbon Champion Review Panel, which is convened by the Institution of Civil Engineers (ICE).


1. Can you walk us through your role at Cromwell, Lara? What are some of the key responsibilities you take on daily?

As it is for many other people, I find that no two days are alike in my role. My key responsibility is to ensure the delivery of the ESG ambitions and commitments that Cromwell has set out while continually building on this ambition. That entails working closely with every facet of the business, and our value chain, to fully integrate ESG into everything we do.

I am committed to ensuring that we aren’t just talking ESG but delivering tangible action to drive sustained positive change. To achieve this, we need everyone to fully understand what ESG means in their world. As such, part of my role is helping to translate what ESG is and what it looks like in different areas of the business.

We don’t need everyone to be an ESG expert; however, we do need everyone to fully appreciate, and deliver on their part, to ensure Cromwell is an environmentally and socially sustainable business. Another important facet of my role, with the help of my team, is to make sure these initiatives happen at pace – and that we provide guidance, direction, and support whenever and wherever needed.

ESG is a framework that helps stakeholders understand how an organization is managing risks and opportunities related to environmental, social, and governance criteria.

2. Looking back, how did your career in ESG and sustainability begin – where did your interest originate?

As cheesy as it sounds, I’ve always wanted to make a difference. I didn’t always know exactly how or in what field, but I’ve always known that I wanted to help make a positive change on the biggest scale possible.

After completing a Bachelor degree in Biology in Southwest France, I realised that the biggest impact I could have would be to help drive positive change within corporate organisations, and thus went on to complete an MBA specialised in sustainable development and environmental management at La Rochelle International Business School. Following my studies, I led a variety of sustainability and ESG roles, always in the most carbon intensive industries, with the aim to achieve my ambition of helping make a difference on the biggest scale possible.


3. In the last decade, particularly, there has been an increasing emphasis on sustainability within the property sector. How does Cromwell intend to manage the expectations of investors, tenants, and staff regarding ESG now; and what does the future hold for Cromwell regarding ESG?

Indeed, the pace of change and maturity regarding sustainability and what it is (and isn’t) has grown exponentially, and I anticipate this will only continue. I expect the breadth of topics will also continue to expand.

For example, some in the industry can still be somewhat biased, and/or have tunnel vision, solely focusing on greenhouse gas emissions and achieving net zero; however, while reducing emissions is crucial, this cannot be at the expense of biodiversity, social value, or natural capital. These topics are all interlinked, and we cannot be successful by focusing on each in isolation. While the industry needs to remain pragmatic, we also need to balance this with a wholistic systems view.

In the spirit of ensuring we aren’t just talking about ESG but delivering tangible action, Cromwell is always actively looking to implement circular and sustainable practices, in addition to constantly seeking opportunities to reduce emissions at scale and at source. Cromwell Property Group has committed to achieve net zero for its entire portfolio for Scope 1, 2 and 3, including tenant emissions and embodied carbon, by 2045 and net zero operational control by 2035.

As a fund manager, a significant proportion of our emissions fall into to our Scope 3 footprint.

Additionally, the business has committed to continuously positively contribute to the communities it operates in and support tenants with their evolving needs. Cromwell has set targets to improve tenant-customer satisfaction to a minimum score of 80% and achieve and maintain an employee engagement score of 80% or higher across the business by 2030.

In terms of what the future holds for Cromwell, the Group recognises the industry challenges relating to environmental, social, or governance topics. While it’s not the easy option, the Group is not shying away from these challenges. As an example, despite the challenges many Cromwell is always actively looking to implement circular and sustainable practices, in addition to constantly seeking opportunities to reduce emissions at scale and at source in the industry face around data quality and availability for Scope 3 emissions, we recognise that this emission scope represents a significant part of the Group’s footprint. We are therefore proactively engaging clients and tenants to obtain Scope 3 data via the roll out of our green lease initiative. We have already achieved 24% roll-out of green leases across our CEREIT portfolio since this initiative was launched. And it’s not just about data collation, Cromwell is proactively engaging its value chain partners about volunteering opportunities within the local community often supporting them with their own ESG agendas.

Cromwell is always actively looking to implement circular and sustainable practices, in addition to constantly seeking opportunities to reduce emissions at scale and at source.
Lara Young – Group Head of ESG, Cromwell Property Group

4. What are some changes or shifting attitudes/trends/practices that you currently see playing out in the corporate ESG space?

Several come to mind. The corporate ESG space has suffered from a constant flow of buzz words, jargon, and acronyms that have led the topic to be inaccessible, overwhelming, and confusing for many. While understanding the nuances of the many definitions is important, there has been a significant effort to simplify and harmonise language and approaches.

There is still some way to go in this regard; however, through this effort, we have seen the ESG agenda seep into disciplines that historically it was omitted from.

This simplification effort has provided greater awareness about ESG across the general public, organisations, and governments which, in turn, adds to the increasing pressure for all to demonstrable evidence the tangible actions and ESG results they are and have delivered so far.

With this growing maturity – and understanding as to what is credible and what is greenwashing – I expect we will soon see greater accountability and assurance from regulators and policy makers on corporate ESG commitments made. This will result in raising the industry norms and standards, positive recognition for those that have delivered on their commitments and litigation and penalties for those that are unable to provide quantifiable and robust results of the ESG benefits delivered.


5. What opportunities regarding ESG excite you, and how do you think Cromwell’s strategy overall could be developed moving forward?

I’m excited about the opportunity to deliver tangible positive change at scale, and not just at Cromwell but in collaboration across the industry with our value chain. Nearly every actor in the industry is faced with the same challenges, and I’m a great advocate of not reinventing the wheel, but rather ensuring that we support and learn from each other. No single organisation can achieve this agenda alone and the opportunity to collaborate at such scale and with so many other disciplines is hugely exciting.

Cromwell’s ESG agenda is a long-term plan that will have to evolve as the ESG agenda matures over the years to come. There is no perfect plan; however, our approach to ensure we recognise, adapt and deliver as the ESG agenda evolves which will ensure Cromwell’s strategy remains aligned to the industry needs.


6. What do you enjoy most about your role?

There are many things I enjoy about my role, but the people I get to meet, engage, and work with is the aspect I enjoy most. Successfully delivering and bringing to life an ESG strategy is a huge team effort that no one person can deliver alone. Thanks to the diversity of my role and the fact that ESG impacts every facet of the organisation and wider industry, I am fortunate to meet many brilliant and inspiring individuals from who I learn a great deal.

Person typing on a laptop

Learn

May 30, 2023

Interest rates and property

Stuart Cartledge


In almost every market update and investor discussion Phoenix Portfolios reminds investors that property is an interest rate sensitive sector. All else equal, if interest rates decline the value of property should go up. The opposite is also true, as has been proven recently: when interest rates go up, property prices are likely to decline. This concept is simple, but its impact is not necessarily spread evenly across different types of property. Below we cover the impact of changing interest rates on various types of property and highlight some of the ways our investment process for the Cromwell Phoenix Property Securities Fund responds to a changing environment.


Residential property

Owning a home is seemingly the goal of almost every Australian. It is ingrained in Australian culture that one should strive to own a home; after all, it is the Australian Dream! A common refrain is “house prices always go up”. This has seemingly been true in most Australian capital cities, but the housing market is, as the name suggests, a market. Prices in a market are determined by demand and supply. This is also true for houses.

Before discussing the demand side of the equation, let’s briefly touch on supply. Many cities across Australia have notoriously challenging property planning regimes. Any proposal to develop new residential housing, or densify existing housing, tend to be faced with local opposition, combined with long and costly planning processes. An example can be seen in one of the portfolio’s holdings, Mirvac Group (MGR), which bought an old hotel in Brunswick, in Melbourne’s Inner North in 2021. Plans to knock down the hotel to build more than 150 apartments are still going through a planning process. At best these apartments will be delivered in 2026, although delays are likely. Since 2011, the number of residential dwellings in Australia has grown at 1.7% per annum1 , with much of that growth taking place on the outskirts of existing capital cities.

As was previously touched on, demand for housing is insatiable. Furthermore, Australia’s population has roughly grown in line with new dwellings and the amount of people living in each dwelling has been consistently decreasing. In a world where supply is limited, what stops prices going up infinitely? The answer is of course people’s capacity to pay. The vast majority of home buyers make use of a mortgage to buy their homes and so the amount that they can afford to borrow, will be very closely linked to how much they are willing to pay for a house. In this context, the impact of changing interest rates should be obvious.


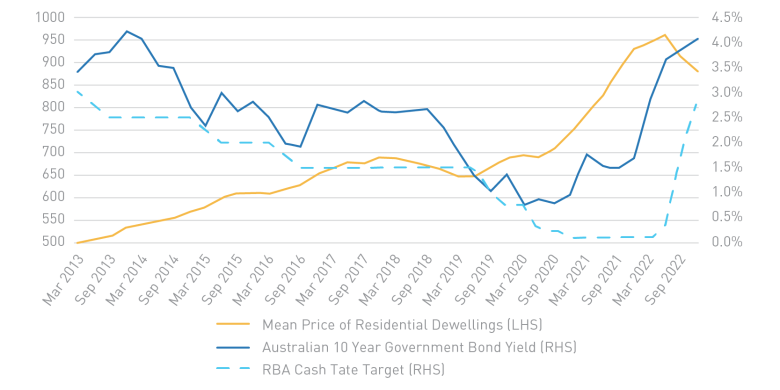
To illustrate this point. The Reserve Bank of Australia’s Target Cash Rate (Cash Rate) has moved from 0.1% to 4.10%. The monthly repayments on a $900,000 mortgage today are equivalent to the monthly repayments on a $1,420,458 mortgage when the Cash Rate was 0.1%. The change in house prices will naturally (inversely) follow changes in interest over time, albeit with somewhat of a lag. This can be seen in the chart on the right-hand side. Note how home prices accelerated when interest rates were at record lows.
Commercial property

Shopping centres, office buildings, industrial properties and other commercial property types may have bigger price tags than your average three-bedroom home, however many of the same dynamics are at play. Like residential property, most commercial property purchases are partly funded with debt. Unlike residential property, where mortgages can commonly comprise 90% of the value of the property, listed commercial property owners in Australia typically employ gearing levels of approximately 30%. Unlike many owner occupiers, commercial property investors require a financial return on their capital. In most cases, this means that debt must be “accretive” to the owner. Put more simply, the cash flow yield of the property should be greater than the interest rate on debt2. A natural relationship that comes from this is that as interest rates increase, the income yield owners require also rises. Assuming the amount of income is stable, this means that the value of the property must go down.


Again, much like residential property, market prices for commercial property are determined by supply and demand. The factors playing into demand are however different to residential markets. Many commercial property investors can, and do, invest across many asset classes. As a collective, their goal is to earn the best return they can in the least risky way possible. To invest in a riskier asset type they naturally require a higher return. An abbreviated list of asset classes and their risk levels can be seen below.


Asset Class Risk Level
Cash Very Low
Government Bonds Low
Corporate Debt Low to Moderate
Property and Infracstructure Moderate to High
Shares High


When interest rates increase, so does the income investors can earn from investing in cash, government bonds and corporate debt. That makes them relatively more attractive. When this happens the demand for property (at the same price as before rates increased) decreases. The return required from property then increases in order to make those returns relatively more competitive with lower risk alternatives.

How Cromwell Phoenix Property Securities Fund manages the impact of rising interest rates

So, with all the negative impacts of rising interest rates, does this mean investing in listed property is doomed? We do not believe so and we have been managing the portfolio for the current environment. Some ways we can adjust to investing in this environment include:

Buying securities at large discounts – The stock market is forward looking and the market prices changes in interest rates on a daily (even moment-by-moment) basis. In some cases, the market can overreact, leaving great buying opportunities. One such example we have discussed in the past is GPT Group, which ended the quarter trading at a discount of almost 30% to its net tangible asset backing.

Buying higher returning assets – Higher yielding assets are less affected by interest rates than their low yielding counterparts. For example, a 0.5% increase in capitalisation rate for an asset previously trading at 4%, represents a greater than 11% decline in value, while a similar move for an asset with a 7.5% capitalisation rate equates to only a 6.3% decline. Phoenix has invested in GDI Property Group, which owns higher capitalisation rate assets such as offices in Perth. The properties have the added benefit of being valued below their replacement cost, further adding to their relative attractiveness.

Buying assets with higher growth outlooks – When interest rates were at record lows, assets with high levels of growth were priced for perfection. This has moderated in recent times. Industrial property rents are growing at record levels, up 20% year-on-year in some domestic markets (and more than 50% in some foreign markets). In fast moving markets these assets may look optically expensive based on this year’s income yield, however are attractive if one looks forward. Phoenix has increased its stake to industrial property, taking meaningful positions in Goodman Group and Centuria Industrial REIT.

Once more it is worth reiterating that property is an interest rate sensitive sector. When we inevitably say this again in the future, hopefully the information above is useful in explaining what we mean. We are however very cognisant of the impact of interest rates along with many other extraneous factors. We will always strive to buy attractively valued securities and are constantly assessing assumptions and adjusting the portfolio to achieve this goal.


Footnotes

1. Source: Australian Bureau of Statistics
2. This is true in most cases, however many consider accretion to “total return”, which includes capital growth as well as income.

About Cromwell Phoenix Property Securities Fund

Read more about Cromwell Phoenix Property Securities Fund, including where to locate the product disclosure statement (PDS) and target market determination (TMD). Investors should consider the PDS in deciding whether to acquire, or to continue to hold units in the Fund.

Person typing on a laptop

Learn

May 8, 2023

March 2023 direct property market update

Peta Tilse


Inflation and interest rates were pushed from the front page in March, as the emergence of a US-led banking crisis took centre stage. A month later, the damage appears to have been largely contained to a few US regional banks and Credit Suisse. However, some financial stability risks remain – and banks are expected to adopt a more cautious approach to lending, which could be a headwind for economic growth. In a positive for domestic investors, however, Australian banks are some of the strongest and most resilient in the world and remain on healthy footing.

As banking concerns subsided, attention returned to the outlook for economic growth, inflation, and whether central banks can deliver a “soft landing”. In April, the IMF slightly lowered its global growth forecasts for 2023 and 2024 by 0.1%. to 2.8% and 3.0%, respectively. Inverted yield curves (where short-term interest rates are higher than longer term rates) signal an increased risk of recession in the US, with the UK and Eurozone economies also forecast to contract in 20231.

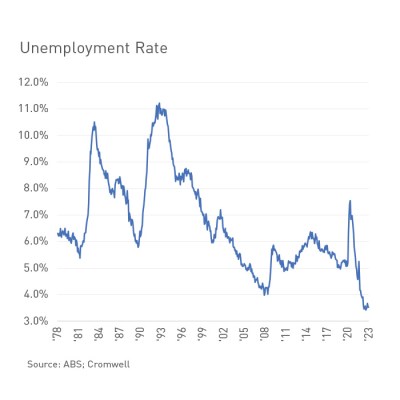
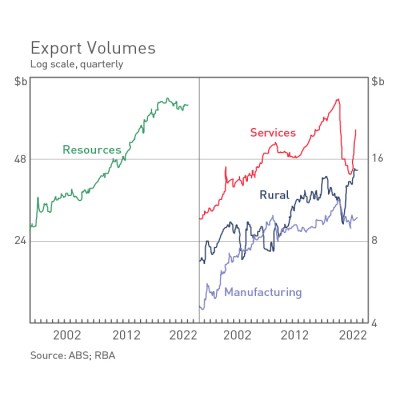
Australia’s outlook is more positive, with the domestic economy’s expansion forecast to continue by 1.0% over 20231. The labour market continues to be a bright spot, with employment rising by 53,000 in March and unemployment remaining unchanged (and very low) at 3.5%2. Exports have also been solid, aided by improvements in the Australia-China trade relationship, with coal exports resuming in the year’s first quarter and tariffs on other products purportedly being reviewed. Significantly, travel restrictions on Chinese students and tourists have been removed, with the increase in student visitors exacerbating Australia’s accommodation undersupply woes.


Figure 1
Figure 2


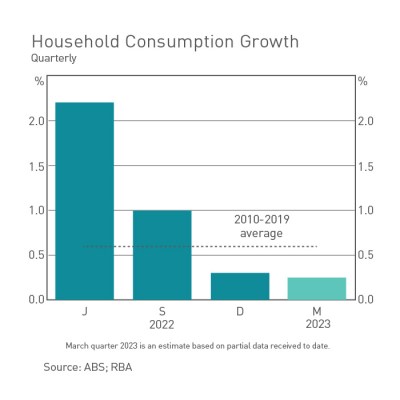
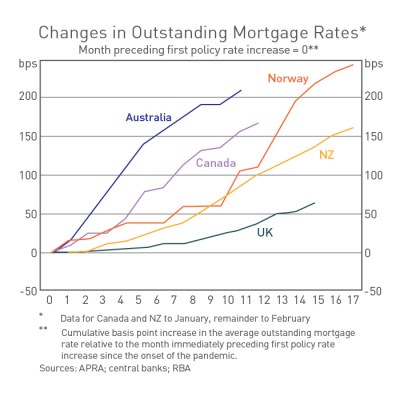
Balanced against these positives is the weakness in the household sector. Retail sales growth slowed to 0.2%2 in February and broader household consumption is running well below trend. Sharply rising mortgage repayments have been the main pressure point, leading to a decline in real disposable incomes. While excess savings that families have built up over the pandemic may have provided a buffer so far, the RBA expects around 15% of households with a variable-rate mortgage will have negative cash flow – i.e., not be able to cover mortgage payments and essential living expenses – by year end. This cash flow pressure, plus pessimistic consumer sentiment, suggests household spending will remain soft over 2023 and below trend (see chart below).


Figure 3 Figure 4


Like other central banks around the world, the RBA is expected to be nearing the end of its hiking cycle. The April pause was broadly welcomed; however, as a result of CPI rising 1.4% for the March quarter – and CPI rising 7.0%.over the twelve months to the March 2023 quarter – the RBA has made the decision to raise interest rates once more in May. Whether more hikes are needed in this cycle will ultimately depend on the trajectory inflation takes. The tight jobs market threatens to push wages higher, but the first quarter’s surge of immigration should ease some pressure – though it will worsen the housing shortage and rental inflation. Cromwell’s inflation forecast for 2023 is 6.2%.

Turning to real estate, demand fundamentals held up over the quarter across all the core sectors. Office recorded positive net absorption, led by Brisbane and Perth. Vacancy increased slightly as new supply reached completion but rents still grew across most markets. Strong demand conditions and very tight vacancy continued to benefit industrial, which recorded double-digit rental growth. In retail, vacancy improved across all centre types, with convenience retail outperforming discretionary shopping centres in terms of rental growth.

Transaction volumes were muted over the quarter, but with inflation moderating and interest rates expected to stabilise in the coming months, liquidity should improve and asset prices should find greater stability over the course of 2023. While listed markets suggest assets face sizeable devaluations, REITs typically experience bigger swings (both up and down) than what happens on the ground. An expansion of cap rates is expected, but income growth may limit the impact to asset valuations.


Outlook

The Australian economy remains in a solid position, despite global headwinds. Inflation is showing signs of slowing, employment is solid, and population growth will provide support to demand over the course of the year. The rate hiking cycle is nearing its end, and financial stability has been maintained despite ructions in the US and Europe.

These factors put the Australian commercial property market in good stead. Businesses continue to adjust size requirements for occupancy as hybrid working continues across industries, although in certain markets this is now largely known. Experiential workplaces with clever refurbishments and amenity continue to attract and retain quality tenants; something Cromwell continues to see within our assets. Capital continues to view Australia as a favourable investment destination, given its attractive demographic profile, growth prospects, and relative social and political stability.

Powerful megatrends – such as the need for more sustainable, energy efficient real estate and rising demand for segments serving the modern economy (such as urban logistics, data centres and highly amenitised offices) – will create income growth opportunities.


How did Cromwell Funds Management fare in the first quarter?

The Cromwell Direct Property Fund (DPF) had no major transactions this quarter and no valuation updates.

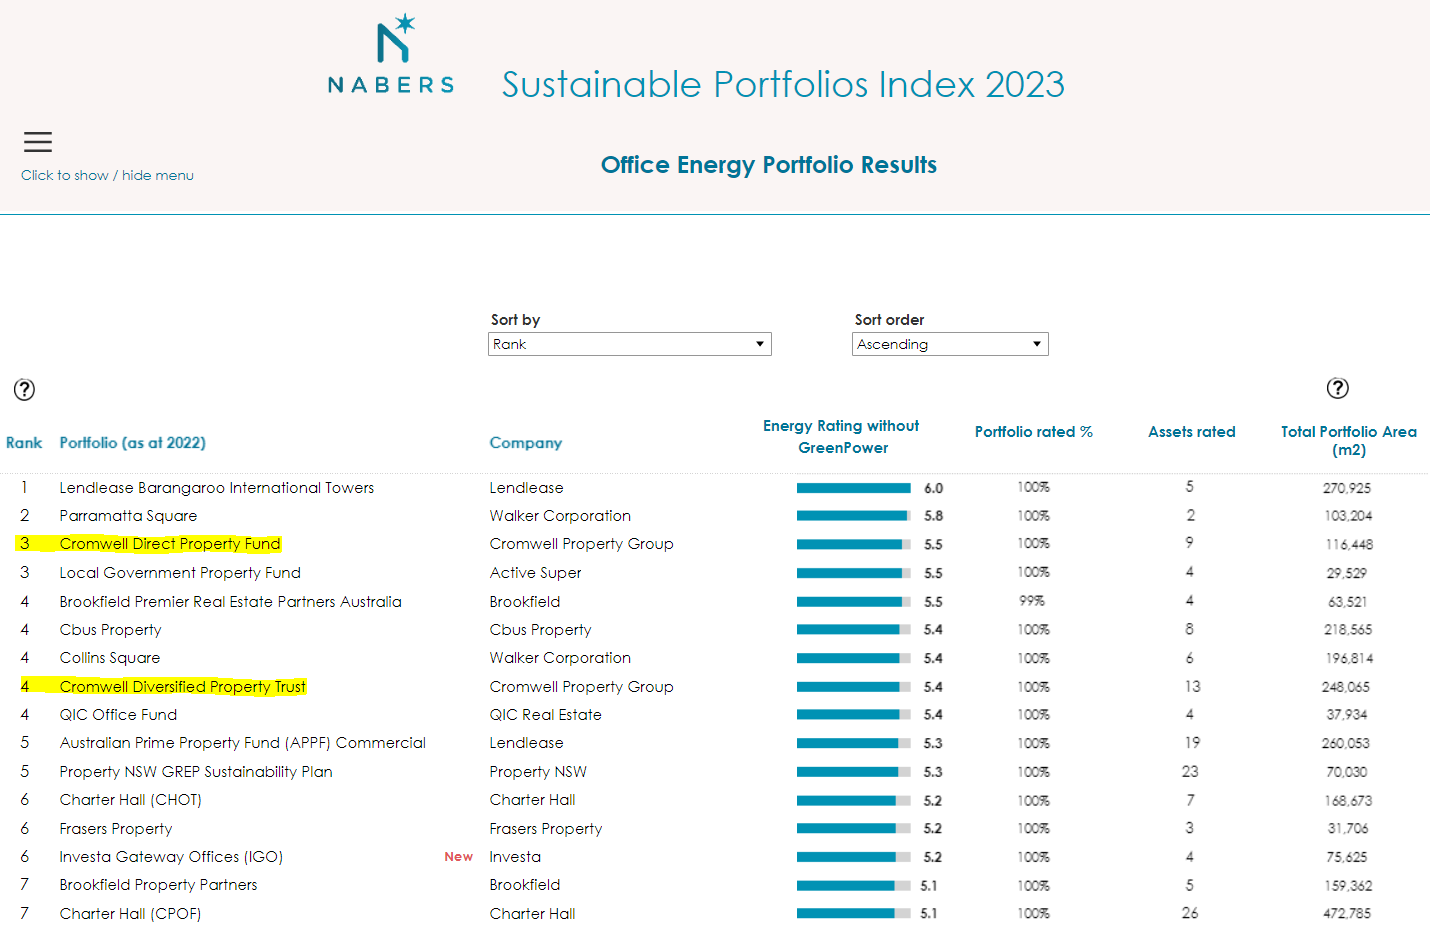
The DPF came 3rd among 64 Australian property funds vying for the NABERS 2023 Sustainable Portfolio Index. Cromwell Group’s Diversified Property Trust came an equally respectable 4th place.

It speaks to Cromwell’s expertise in the all-important ESG space to have a fund with 9 properties of varying ages (including Creek St Brisbane completed in 1977 and Queen St Brisbane 1982) compete so strongly against assets that have been completed within the last 10 years (the winner Barangaroo completed in 2016 and runner up Parramatta Square in 2022).

This is a testament to our hard-working Property Team, which constantly monitor and manage our assets from the ground up, optimising operational efficiencies as well as providing superior tenant experience.

March-2023-direct-update-Sustainable

 
Performance (%) p.a as at 31 March 2023

Year Cash (AU) Bonds (AU) Shares (AU) Cromwell Direct Property Fund3
1 2.04% 0.35% -0.57% 0.13%
3 0.73% -2.37% 16.59% 5.95%
5 1.08% 1.27% 8.64% 6.44%

Source: Lonsec and Cromwell Funds Management


1. Capital Economics
2. ABS
3. Based on current distributions of 6.75 cents per unit p.a. and a current unit price of $1.2646 as at 31 March 2023

Cronmwell Direct Property Fund

Learn more about the Cromwell Direct Property Fund here

Person typing on a laptop

Learn

May 8, 2023

March 2023 quarter ASX A-REIT market update

Stuart Cartledge


Market commentary

The S&P/ASX 300 A-REIT Accumulation Index moved marginally higher in the first quarter of the year – rising 0.3%. This performance can be seen as relatively muted, considering the 10-year Australian Government bond yield dropped 0.5% over the quarter. The broader equity market outperformed property, with the S&P/ASX 300 Accumulation Index adding 3.3%. In February, most companies under coverage reported their half yearly earnings to 31 December 2022.

Valuations were broadly flat across the sector, although the tone was more cautious looking forward. A feature of discussions surrounded the impact of rising interest rates on future earnings and property valuations. Interest rate relief towards the end of the quarter should support earnings and limit downward revisions to valuations.

REITs with exposure to office markets were underperformers in the first quarter of the year. Amongst an environment of concern over the future use of office spaces, vacancy and incentives in key markets have remained stubbornly elevated, leading some to have concerns surrounding the sustainability of cash flows coming from office building ownership.

Many listed office owners argue that there will be a bifurcation, by which higher quality offices will endure and lower quality buildings will face a challenging future. Time will tell if this is correct. For the quarter, Cromwell Property Group (CMW) lost 15.1%, while Mirvac Group (MGR) dropped 2.3% and Dexus was off 3.1%. Charter Hall Group’s (CHC) earnings are particularly leveraged to office markets, given its franchise in office funds management. Its share price fell 8.2% during the quarter.

The drop in bond yields and short-term interest rate expectations were supportive of residential property developers during the period. Stockland (SGP) is the largest residential land developer in the country and as such rose 9.6% during the quarter. SGP’s management had previously suggested they would slow down land accumulation in a weakening market. At its half yearly report, the tone changed, with a goal to add to its land bank, supported by a new joint venture with Japanese real estate developer Mitsubishi Estates.

Smaller capitalisation residential developers AV Jennings Limited (AVJ) and Peet Limited (PPC) also outperformed, gaining 4.0% and 3.1% respectively. Owners of large shopping centres reported resilient financial results to 31 December, with specialty sales and rental outcomes broadly above expectations. Vicinity Centres (VCX) upgraded its full year earnings guidance, supported by almost flat re-leasing spreads, improving from -6.8% at the same time a year ago. VCX finished the quarter up 0.1%. Scentre Group (SCG) released earnings guidance for calendar year 2023, which was higher than expectations. It finished the quarter down 1.6% with some fearing a weaker economy moving forward.

Offshore, Unibail-Rodamco-Westfield (URW) outperformed on the back of results that are best summarised as less bad than expected. For the quarter it rose 3.6%. Industrial property owners faced a mixed period. In terms of property valuations, capitalisation rates increased sharply, however valuations were mostly slightly higher, supported by an acceleration in market rents around the nation’s industrial leasing markets. Industrial fund manager Goodman Group (GMG) led the way, adding 8.2%, while Growthpoint Properties Australia (GOZ) lifted 2.0% and Centuria Industrial REIT (CIP) gave up 2.6%.

Valuations were broadly flat across the sector, although the tone was more cautious looking forward.

Market Outlook

February’s reporting season showed a property sector that was mostly performing solidly from an operational perspective. Increased interest rates are however unmistakably a drag to earnings, given the use of debt across real estate investment trusts. Current gearing levels are however very manageable. Property valuations to 31 December 2022 mostly showed slightly negative revaluations.

The industrial sub-sector continues to be the most sought after, given the tailwinds of e-commerce growth, the potential onshoring of key manufacturing categories and the decision by many corporates to build some redundancy into supply chains to cope with current disruptions. All of these factors will support ongoing demand for industrial space, which is evident by rapidly accelerating market rents for properties.

The jury is still out on exactly how tenants will use office space moving forward, but demand for good quality well located space remains. Transactional activity of office assets continues to provide some evidence of value, but transaction volumes have recently reduced. Incentives on new leases do remain elevated and some vacancy in the market is becoming apparent.

We remain cognisant of the structural changes occurring in the retail sector with the growing penetration of online sales and the greater importance of experiential offering inside malls. Recent performance of shopping centre owners has however been strong, with consumers showing resilience. It is interesting to note the juxtaposition of very high retail sales figures despite very low levels of consumer confidence, no doubt impacted by rising costs of living.

The recent increase in bond yields does present a headwind for all financial assets, and particularly yield based sectors such as property. However, with key large capitalisation REITs now trading at a significant discount to the value of their underlying assets and with no value ascribed to embedded active businesses, we believe the sector offers value, particularly in comparison to unlisted property.

Phoenix has for some time discussed the risk of inflation, given the enormous fiscal stimulus and extreme monetary policy setting that we have lived through. In recent times, commentators and bond markets have begun to react to the presence of such a risk. In this environment, long leases with fixed rent bumps, which were previously in high demand, may become relatively less attractive. Historically, real assets such as property and infrastructure have performed well during inflationary periods.

About Stuart Cartledge

Stuart is the Managing Director of Phoenix Portfolios and the portfolio manager for each of the company’s property portfolios. Prior to establishing the business in 2006, Stuart built a strong track record in the listed property security asset class and has been actively managing securities portfolios since 1993. Stuart holds a master’s degree in engineering and management from the University of Birmingham and is a Chartered Financial Analyst.

Person typing on a laptop

Learn

April 5, 2023

Benchmark unaware investing: A guide for investors


In this article, we examine what it means to be an active or passive investor, and compare the two styles that best represent these polar opposites, benchmark unaware and index investing.

Passive versus active investing

Passive investing is the strategy traditionally employed by index funds and Exchange-Traded Funds (ETFs), whereby the manager holds a portfolio that mirrors the index, and no over or underweight strategies are employed. The investment objective of a traditional index fund or an ETF is therefore to track, but not outperform, its chosen index in the most cost effective manner possible.

Passive investing has become increasingly popular in recent years due to low fees and the average active managers’ inability to outperform over the long term. In the United States, index funds now hold nearly half of the listed share market, while the ETF sector in Australia reached a record high $26 billion in funds under management in February 2017.

Exchange Traded Funds (ETFs) are unitised investment funds that replicate an index, with the objective of mirroring the index’s returns. Units in an ETF are traded on the stock market like ordinary securities.

Conversely, active investing is a strategy whereby the manager builds the portfolio by evaluating stocks based on factors such as value, distribution, asset and manager quality. The fund manager can choose to take positions without regard to their size or benchmark weightings, including investing in companies with minor weightings, such as small capitalisation stocks.

The higher fees associated with active investing strategies should be rewarded with investment outperformance.

On a side note, active investing can also work with benchmark aware investing, to a limited extent. A benchmark aware fund manager, while restricted to selecting stocks based on the benchmark weightings, might also engage in strategic active investing by selecting stock weights within defined limits such as 5% either side of the benchmark position.

In the United States, index funds now hold nearly half of the listed share market, while the ETF sector in Australia reached a record high $26 billion in funds under management in February 2017.

Performance against a benchmark– what does it mean?

Investors need some way of tracking how their investments are performing, relative to the specific market sector, and in most cases, performance is assessed against the most relevant benchmark.

A benchmark is defined by the Australian Securities Exchange (ASX) as “a collection of assets that provide a broad representation of an asset class,” acting as a barometer for its performance. As an example, many Australian Real Estate Investment Trusts (A-REITs) will benchmark their performance by either the S&P/ASX200 A-REIT index, or the wider S&P/ASX300 A-REIT index.

At 31 July 2017, the S&P/ASX300 A-REIT index comprised of 31 companies covering retail, office, industrial, logistics and specialist sectors. Each company has a specific weighting in the index, depending on market capitalisation (company size as measured by stock price). At 31 July 2017, this index had a market capitalisation of $125.3 billion in total.

An index fund manager will build a portfolio purely based on the composition of the index and the weighting of each individual stock. An index fund manager will therefore take no strategic positions and consequently will be expected to return a performance exactly the same as the relevant benchmark.


The constraints of index investing

The domination of certain indices by large capitalisation stocks should be considered as it can significantly reduce diversification for an index investor.

In the case of the S&P/ASX300 A-REIT index, the top 10 index constituents accounted for 86% of the overall index as of 31 July 2017. The performance of a small number of companies therefore can have a material influence on the index’s overall return, and in an index investment strategy, can expose investors to being heavily weighted to a very small number of stocks.

Furthermore, indexes can be heavily weighted to certain sub- sectors. In the case of the S&P/ ASX300 A-REIT index, the retail sector accounts for more than 50% of the benchmark, and this too can impact on overall benchmark performance.

For example, in the year to 30 June 2017, concerns about the retail sector due to the “Amazon effect” hit large-cap retail A-REITs such as Scentre Group, Vicinity Centres and Westfield Corporation particularly hard, with returns of -13.4%, -17.3% and -21.5% respectively.


The potential sitting outside the index

The S&P/ASX300 A-REIT index also excludes smaller REITs with market caps below $350 million. Some of these have performed well, including Centuria Metropolitan Office (up 25.5% in fiscal 2017) and Australian Unity Office Fund (up 11.4%). In fact, the median performance of the smallest eight A-REITs in the index was a positive 9.9%, although the impact on the total index return was minimal due to the much smaller weighting of these stocks.

In such an environment, benchmark unaware managers have an opportunity to outperform. Without the requirement to maintain benchmark weightings or invest exclusively in benchmark stocks, they can invest in a much wider range of stocks.

A benchmark unaware strategy also allows for the potential to reduce volatility, with the opportunity to diversify across a wider selection of stocks, and no requirement to own a “risky” stock purely because it is part of the index.

For property investors, index and benchmark unaware styles both have advantages and disadvantages, with the benefits of the former including the lower costs, comfort of tracking the index and not being reliant upon an investment manager’s skills. Yet with the performance of the S&P/ASX300 A-REIT index masking wide disparities in stock and sector weights and returns, a benchmark unaware active approach can provide skilful managers with the opportunity to potentially deliver superior returns.

Person typing on a laptop

Learn

March 20, 2023

December 2022 direct property market update

Peta Tilse


2022 was characterised by inflation, supply constraints, and geopolitical tensions (including war), which led central banks to lift interest rates at the fastest pace in decades, and in turn softened performance in asset markets of all persuasions.

As we enter 2023, many of these factors continue, albeit at a slower pace and under the shadow of the risk of recession. Australian growth moderated in the third quarter, bringing the year-on-year pace to 5.9%, and forecasts for final growth in 2022 to 3.6%.

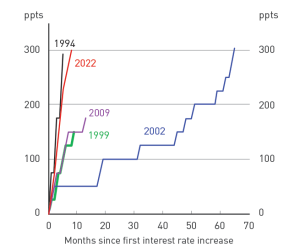
The December quarter saw the RBA lift rates a further 75bps with 25bps announced at each of the monthly meetings. The movements confirmed this interest rate hike cycle to be the fastest since 1994 (see red line in Figure 1).

Australia was not alone with its steep interest rate trajectory of 300bps, as other central banks also moved quickly to stamp out inflation;

  • the US Federal Reserve +425bps,
  • Bank of England +325bps,
  • and the ECB +250bps.


Figure 1: RBA rate hike cycles Figure 2: total volumes by sector
& % offshore investment
Source: CommBank, Economic Insights Global
Economic & Markets Research, Dec 2022
Source: CBRE Research


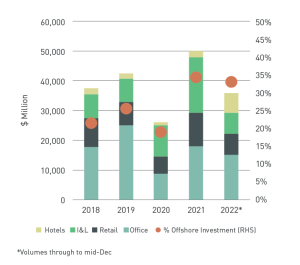
The net effect of these moves has been an increase in mortgage repayments of around 40-60% for the average borrower. Coupled with higher energy prices, this has added to cost of living pressures for most, reducing the affordability of residential property. Transaction activity in Australian commercial real estate slowed into late 2022 with CBRE reporting total volumes of $35.9 billion, compared with 2021’s $50.5 billion in 2021. The office sector formed the lion’s share of what was traded at $15.2 billion (42%).


The cash rate now stands at 3.1%, with the RBA minutes released in December indicating the RBA Board is considering for the first time this interest rate cycle the option of “no change”. This has given confidence to markets (both here and abroad) that we are indeed approaching the peak in the cash rate.


Our Cromwell inflation forecast for 2023 is 5%, which is below the annualised rate to October of 6.9%. The drivers to inflation remain as below; however, we expect to see inflation drop to 3% in 2024.


The drivers to inflation remain as below; however, we expect to see inflation drop to 3% in 2024.


With inflation moderating and interest rates stabilising, liquidity should improve and asset prices should find greater stability. The following charts plot historical Cap Rates for office, retail, and industrial vs a “real” 10-year yield (i.e. stripping out inflation) and the difference (spread) over an almost 20-year period. The inflationary effect stripped out shows the relative value of the sectors. It also explains in part the reduced volume of assets traded in the last half-year as vendors have been unwilling to re-rate pricing.


Figure 3: historical cap rates for office, retail, and industrial
December-2022-direct-cap-rate
Source: FactSet, JLL, Macquarie Research, November 2022

Outlook

The Australian economy remains robust, despite headwinds. Employment is solid – with unemployment hovering around 3.5%, while job vacancies remain particularly high. Economic growth maintains positive momentum dominated by export demand for resources.

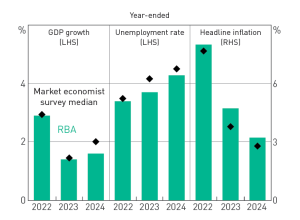
The RBA expects some of this to continue – with the unemployment rate to remain around 3.5% in 2023, weakening to 4.5% in 2024. While it expects inflation to peak at around 8% in 2022 (dominated by higher food prices & energy), it expects it to gradually move down to ~3% by 2024 year-end. Economic growth will slow (we expect to around 2% in 2023), but still remain positive and impressive compared to other western countries.

These factors along with business conditions at a healthy ~30 year high1 put the Australian economy and commercial property market in good stead. Businesses continue to adjust size requirements for occupancy as they live with hybrid working, although in certain markets this is now largely known.

Experiential workplaces with clever refurbishments and amenity continue to attract and retain quality tenants; something we continue to see within our assets.

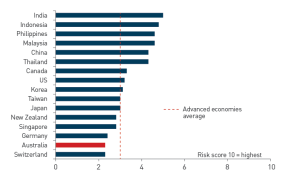
In a global context, Australia is in a position of strength, with a compelling economic outlook, comparatively low inflation compared to Europe and the US and an attractive demographic profile. Oxford Economics, therefore, estimate Australia’s economic risk to be one of the lowest of the advanced economies.

This should in turn support tenant demand for good quality real estate to facilitate economic growth and cater for a growing and ageing population. Liquidity from both domestic and international capital is likely to improve. In conjunction, powerful megatrends such as the need for more sustainable, energy efficient real estate and rising demand for segments serving the modern economy such as urban logistics, data centres and highly amenitised offices will create income growth opportunities.

Figure 4: RBA and Market Economist Forecasts Figure 5: Economic risk: Australia vs advanced economies average
Source: ABS; RBA Source: ABS; RBA


How did Cromwell Funds Management fare this quarter?

The Cromwell Direct Property Fund sold Allara Street, Canberra, this quarter. The property was originally bought in July 2015 for $16.8m and was sold in October 2022 for $18.187m. Sales proceeds were used to reduce debt. Gearing as at 31 December 2022 was 36.3%. Further leasing success post 31 December at Queen St Brisbane, Creek St Brisbane, and Grenfell St Adelaide will improve the current 93.6% occupancy rate and 4.6-year WALE.

The Fund currently distributes 6.75 cents per unit p.a., or 5.29%2, payable monthly, and has generated annualised total returns since inception of 8.8% p.a. The Cromwell Direct Property Fund continues to demonstrate excellent risk adjusted returns for investor portfolios.

Performance (%) P.A as At 31 December 2022

Year Cash (AU) Bonds (AU) Shares (AU) Cromwell Direct Property Fund
1 1.25% (9.71%) (1.77%) 0.7%
3 0.55% (2.87%) 5.51% 6.1%
5 1.01% 0.54% 7.10% 6.8%

Source: Lonsec and Cromwell Funds Management


Footnotes
  1. NAB Business Survey – Business Conditions
  2. Based on current distributions of 6.75 cents per unit p.a. and a current unit price of $1.2755 as at 31 December 2022
Person typing on a laptop

Learn

March 5, 2023

Timber buildings – Truly sustainable real estate


In this special report, our Research and Investment Strategy team explore how timber buildings can be a critical part of the solution the real estate industry needs to mitigate climate change.

The report takes a deep dive into timber as a renewable building resource. Alex Dunn and Tom Duncan explore how using timber in new building construction can deliver positive environmental impacts and lead to truly sustainable real estate. They provide a balanced view of the benefits and challenges of timber construction; address some common misconceptions around its use and consider the advantages from an occupier and investor perspective. This is essential reading for all real estate stakeholders who are serious about enacting impactful environmental change.

Explore timber as a renewable building resource

Read the full Timber Buildings – Truly sustainable real estate report and find out more.

Person typing on a laptop

Learn

February 17, 2023

The physical office in a hybrid world


Why changing occupier demand means investment opportunity

Hybrid working, where white-collar employees divide their working week between home and the office, is now the default for Australian companies. This trend was in motion prior to the pandemic, but has been accelerated and solidified by it, establishing it as the norm.

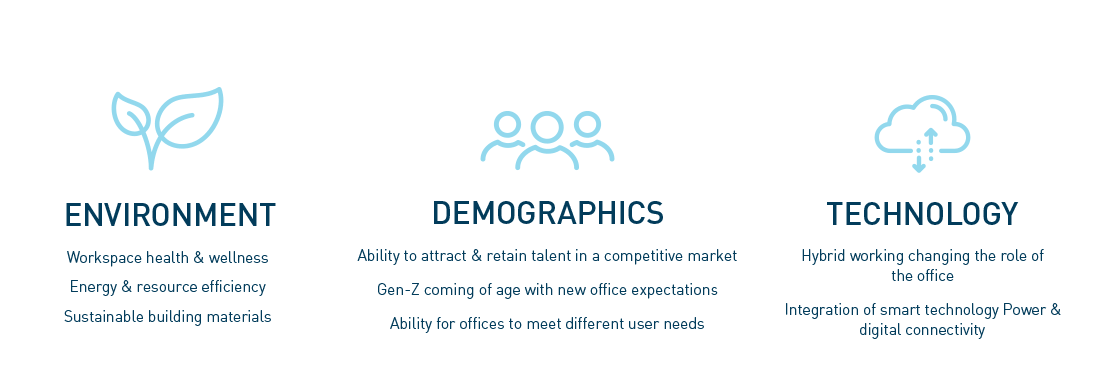
With employees in the office fewer days per week, the role of the office has changed. In parallel, other structural themes are shifting occupier expectations about their offices faster than the market can adapt. These themes include the environment and the need for offices to help mitigate the climate crisis; demographics with a new group of gen-Z employees born since 1997 coming of age; and technology changing the type of work that is done and where it is undertaken (Figure 1). For informed investors who act with conviction, filling the supply gap by providing office space suitable for modern occupation brings performance opportunity.

Figure 1: The themes behind new office requirements

Demand: Successful office criteria have changed
In a hybrid workplace, the office is used selectively by employees for specific tasks that cannot be done at home. These tasks include collaboration, team/client meetings, knowledge-sharing, training, and company culture-building. With employees empowered to choose their working location, the office must also make a better pitch to workers to justify the time, expense, and inconvenience of commuting if it is to be well-used.


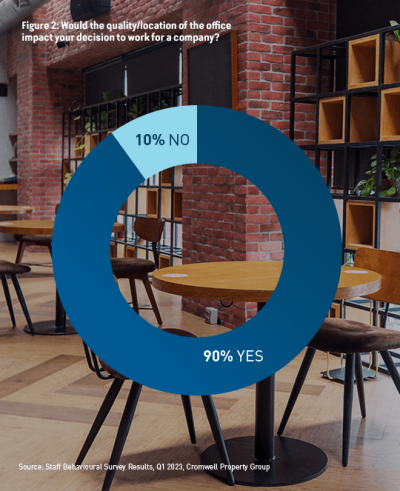
This requires redesigned space, which provides flexibility and can be used for different tasks throughout the week. Shared spaces are in, permanent desks are out. It means a greater focus on experience, with aspects like vibrancy, atmosphere, and amenity being important – think better kitchens/cafes, funky decor and outdoor spaces within the workplace and the immediate locality. Occupying a quality well-located office is essential if companies are to attract and retain talent, as our global survey of workers reveals (Figure 2).


Another key criteria today is sustainability. This includes health and wellness aspects like air quality and biophilia (plants), energy efficiencies to reduce emissions and mitigate high energy costs, and quantifying the carbon embodied within the building itself. These considerations are important, because reducing greenhouse gas emissions is a priority for corporate occupiers – with 77% of 400 global companies recently surveyed by Knight Frank having a net zero target of 20301. Achieving this will require occupying sustainable offices.


Supply: Much of the market does not meet modern occupier need
Occupier demand has shifted rapidly to reflect these requirements, but supply takes longer to realign. Though office space overall may be oversupplied if less space is needed per worker, the provision of space that meets today’s occupier demand is arguably undersupplied. Furthermore, this demand is concentrated predominantly on CBD locations that minimise commute times and maximise access to amenity, further widening the demand-supply gap.

According to JLL data, prime office space comprises just one quarter of the total office space within Australia’s five main CBDs. Prime vacancy in Sydney and Melbourne CBDs is above average but, as lease events occur, it is likely that this space will be absorbed by occupiers relinquishing older quality space within the CBD or suburban locations – perhaps taking a smaller footprint overall but paying more per square metre for it. In addition to prime CBD space, we expect buildings with character – such as former warehouses or heritage buildings – in amenity-rich, accessible fringe locations will attract strong occupier interest.


Implications: Filling the supply gap will deliver returns
The conditions of high occupier demand for a specific type of space and low supply create a compelling strategy for owning, buying, or creating quality stock that is suitable for modern occupiers in CBD and select fringe locations. Offices continue to be impacted by negative investor sentiment associated with cyclical economic conditions and uncertainty over the future of work. However, rational analysis of prevailing structural themes and market trends suggests that acting with conviction now to construct portfolios that provide the space modern occupiers want will deliver solid returns. With the right strategy, the greatest performance potential lies in targeting poor quality, unloved office space in good locations which can be upgraded to todays’ standards.


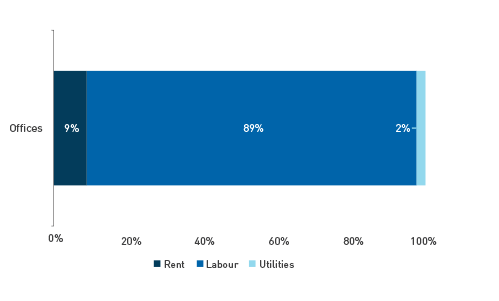
Figure 3: Typical cost structure for office occupiers


Source: Cromwell Property Group/Wall Street Journal, Q1 2023

Occupier competition for suitable space is likely to support rental growth, even in a higher inflationary environment. Our analysis shows that for the typical office occupier, rental costs constitute a mere 9% of total operational costs (Figure 3). If leasing better quality office helps to increase the ability of a company to attract and retain labour – a far larger cost item – and support labour productivity, they will pay more for it.

Over the last 25 years, analysis of prime rental growth in Australia’s five main CBDs against CPI shows that in all cases, rental growth has exceeded inflation. In today’s hybrid working world, the business-critical importance of suitable office space combined with its limited supply will create an even stronger rental growth impetus regardless of the inflationary and economic growth outlook.

Occupier competition for suitable space is likely to support rental growth, even in a higher inflationary environment.

Conclusion: bifurcation of demand implies strong future performance for the best space

The demand for office space has evolved rapidly over the last few years and supply has not kept pace. As demand continues to concentrate on the minority of space suitable for modern occupation, the supply-demand mismatch will widen. Investors who own or can acquire or create the space occupiers want where they want it are well positioned for future rental growth.


Footnotes
  1. Source: Knight Frank, Outlook Report 2023