Taking advantage of the property cycle
Colin Mackay, Research and Investment Strategy Manager, Cromwell Property Group

Colin Mackay, Research and Investment Strategy Manager, Cromwell Property Group
In our view, the commercial property market cycle includes four phases:

Peak: This phase features strong economic growth, rising property prices, and high investor confidence. Demand accelerates and vacancy rates drop well below normal levels. However, it can also lead to overvalued assets as sentiment moves ahead of underlying property performance and prices reach their zenith. Interest rates may also start to rise in this phase as the RBA seeks to take some ‘heat’ out of the economy.
Slowdown: In this phase, market dynamics shift, leading to weaker demand and softening prices. Construction, which typically picks up in the expansion phase, starts to create an oversupply and vacancy rates increase. Interest rates continue to rise, impacting jobs growth and slowing the economy. Sentiment worsens, perpetuating falling prices.
Trough: Characterised by low investor confidence and sometimes widespread despondency, this phase sees prices hitting their lowest point. However, it can also present opportunities for investors to buy undervalued assets at attractive prices. Towards the end of this phase, rate cuts often stimulate activity and lay the foundation for asset appreciation.
Expansion: During this phase, economic and financial conditions improve, boosting investor confidence and supporting asset prices. This is typically the longest phase, underpinned by moderate growth rather than the sentiment-driven extremes of the market peak and trough.
Property market cycles repeat over time, but each one is unique. This is because the intensity and duration of a cycle depends on a multitude of factors such as macroeconomic conditions, geopolitical events, investor sentiment, and unexpected occurrences like natural disasters or global pandemics. Sectors within a market and even different locations can be at different phases of the cycle at the same point in time.
Now that we have the basics covered, let’s take a look at the current property market.

As mentioned above, macroeconomic conditions play a big role in property cycles. Recently, we’ve seen a significant increase in interest rates – 425 basis points in 18 months, which has significantly impacted commercial property prices. However, many believe that interest rates have peaked for this cycle. Other countries such as the US, Canada, New Zealand, and several across Europe, have already started lowering rates.
Australia’s inflation cycle took hold around six months later than peer markets and rate cuts are also expected to commence a bit later (around early next year). Cromwell expects lower interest rates will boost market confidence, stimulate transaction activity and support property prices.
We’re starting to see signs that property prices may be stabilising. The pace of capitalisation (cap) rate expansion (a driver of declining property values) is slowing for retail and industrial properties, an indication that the cycle may be turning for these sectors. It is important to note that because the valuation cycle lags, waiting until market valuation cap rates have started to compress means the best buying (i.e. the bottom of the cycle) has actually already passed you by.
For office properties, cap rate expansion is yet to slow but should follow the example of retail and industrial, in part supported by the emerging cap rate differential to the other sectors, which will boost the relative attractiveness of office investment. Increased transaction activity is another sign that the market cycle might be turning.

While the macroeconomic and capital cycles appear to be becoming more favourable, they would be of little consequence if office market fundamentals were too far out of sync. Despite some challenges, like high vacancy rates in Sydney and Melbourne, there are still reasons for investors to be optimistic about the office market.
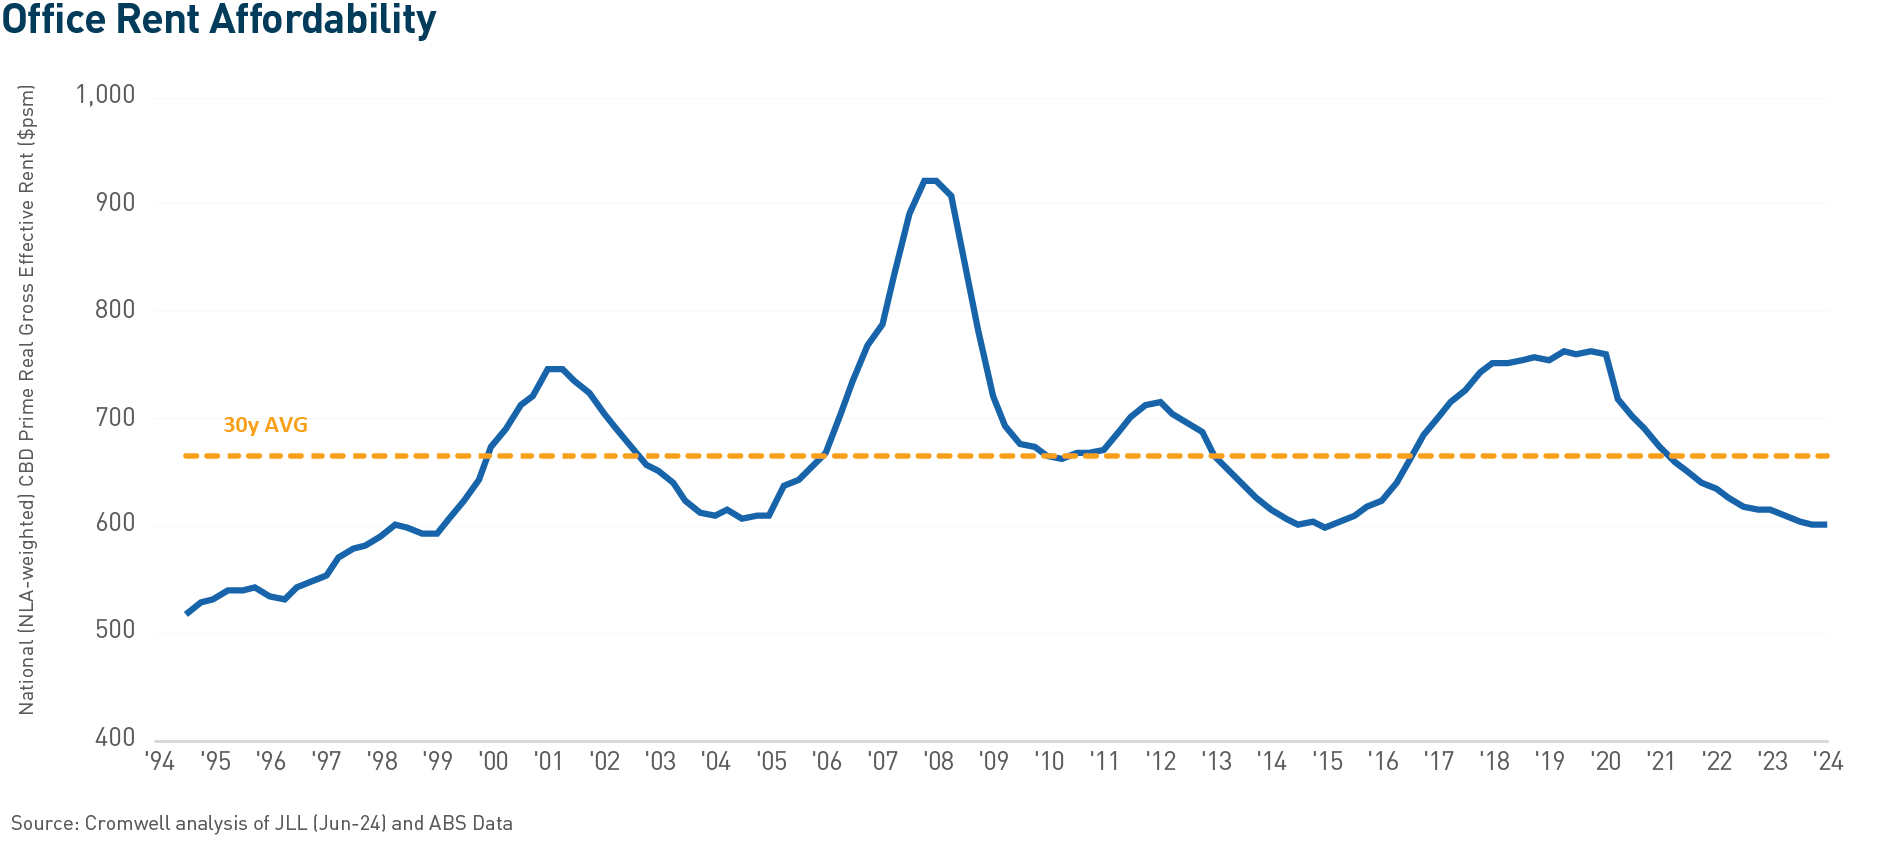
Firstly, rents are at cyclical lows, similar to the levels seen after the early 90s office market blowup. With rents at low levels, occupiers aren’t under financial pressure to reduce their space or avoid expanding if they’re growing. This also means that cutting office space or rent isn’t the first option for saving costs. Companies understand that losing staff or having lower productivity due to a poor work environment is a bigger risk to their profits.
The other cyclical element of office fundamentals is the development pipeline (i.e. supply risk). This is relatively small, with the amount of national CBD stock expected to grow by only 0.9% per year from 2024 to 20281, compared to the 20-year average of 1.6% per year2. It’s not practical to build new offices unless they are already under construction or part of an infrastructure project, due to low rents and high construction costs affecting profitability.
It’s unlikely this dynamic will be resolved any time soon, with construction cost inflation expected to remain elevated3 and state infrastructure pipelines set to continue outcompeting for scarce resources and labour for at least several years. The lack of new development is good for the performance of existing buildings, helping to balance supply and demand and support rental growth.
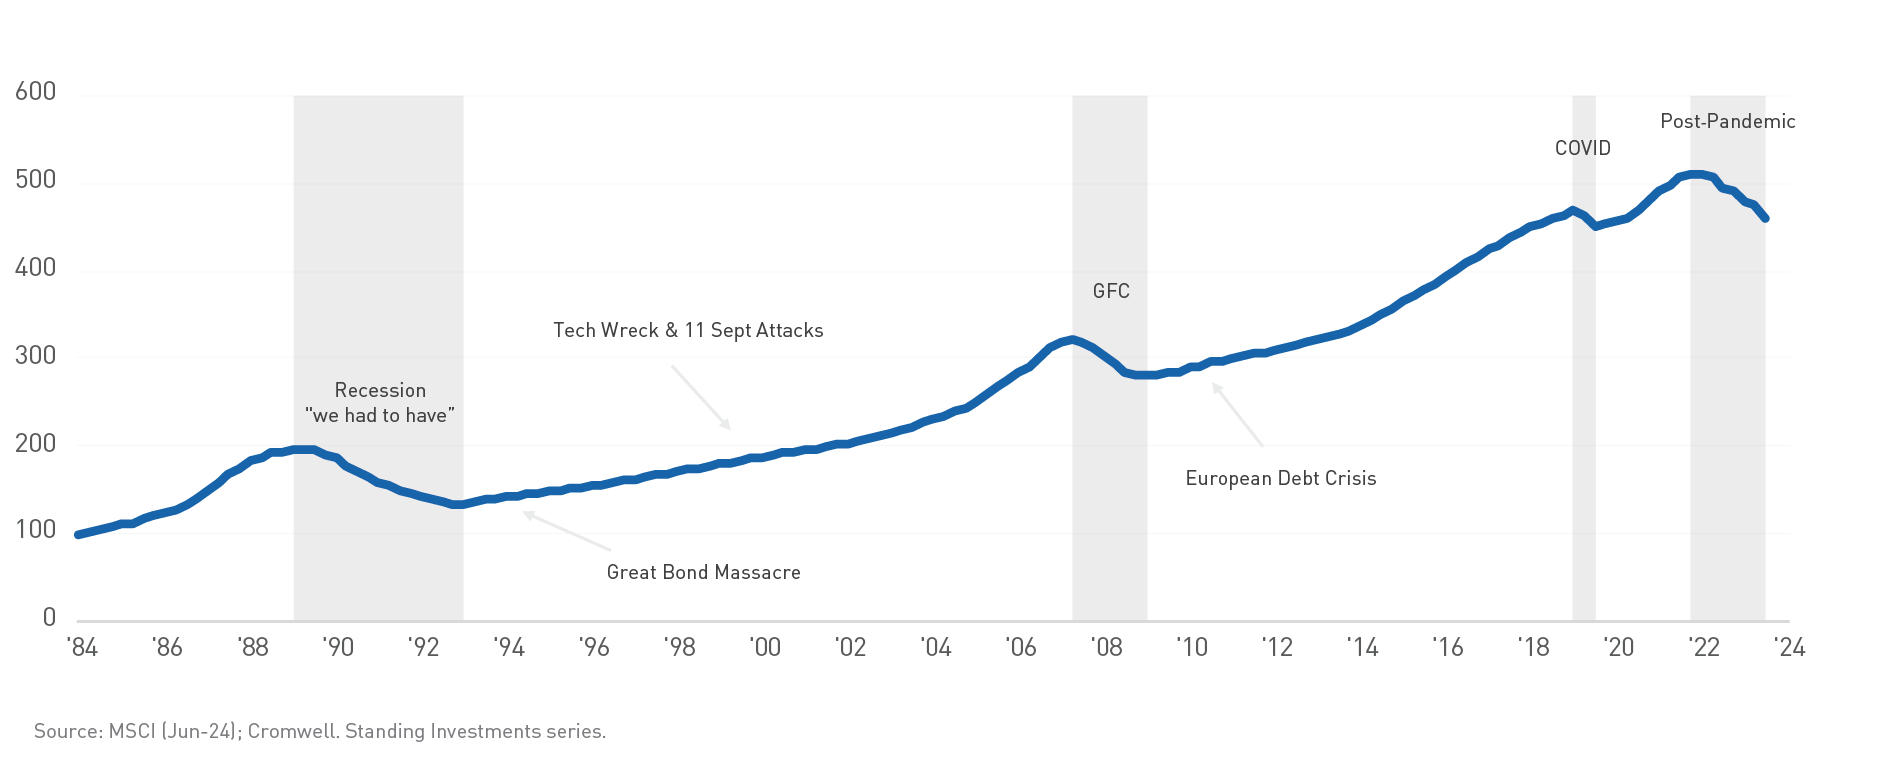
Over the past 40 years, investing in Australian office, industrial, and retail properties has generally paid off, with property values growing steadily despite facing a number of downturns and crises. While looking at a shorter timeframe will accentuate cyclical ups and downs, the market has shown a long-term upward trend.
Adopting a long-term approach when investing in property means investors can benefit from this steady growth. This approach helps avoid the stress of predicting market movements. Sticking to a disciplined, long-term strategy based on solid fundamentals can help investors navigate market cycles, reduce risk, and build wealth over time.
It’s hard to know exactly when any market will peak or bottom out, but there are signs that can give clues about the general position of the commercial property cycle – whether it’s falling, stabilising, rising, or peaking.
With rate cuts expected in 2025, financial markets believe the overall economic cycle is close to turning. Similar signs are appearing in commercial property, with slower cap rate expansion in some sectors and increased transaction activity. For office spaces, very low rents and limited supply are reasons for optimism and present a good buying opportunity.
For investors who have the courage and capital to buy now, the benefits can be significant. Attractive prices are available, with buyers able to take advantage of distressed sales and the gap between market fundamentals and sentiment. While choosing the right properties is still crucial for investment returns, getting in early and riding the market upswing can provide a strong advantage for investors. Those who have been patient and held onto their investments through this stage of the cycle are also likely to benefit.


Stuart Cartledge, Managing Director of Phoenix Portfolios
Capitalisation rates, commonly known as “cap rates”, are a fundamental metric in Australian property investing. When a commercial property is sold, two pieces of information will be widely reported. Firstly, the amount the property sold for and secondly, the cap rate. Often properties will be compared by their respective cap rates. Reports will often comment on the “implied cap rates” of different property securities. However, this seemingly simple and ubiquitous measure can be far more complex to use when comparing different types of properties.
Whilst different market participants may mean different things when referring to a cap rate, the Property Council of Australia (PCA) defines a cap rate as a property’s net operating income (NOI) divided by its property value estimate. For example, if a property generates an annual NOI of $500,000 and is valued at $10 million, the cap rate would be 5%. A purchaser might assume that they would receive a cash flow yield of 5% plus any rental growth that may occur. This isn’t necessarily the case and ignores key considerations.
Commonly, properties require meaningful ongoing investment, which isn’t reflected in the NOI used to calculate cap rates. This investment is known as capex and comes in many different forms. It may be maintenance capex, which refers to significant replacements or additions to maintain the standard of an existing building. For office properties, this may include replacing lifts or air conditioning units, each of which may need a full replacement as often as every 15 years. For shopping centre properties, capex may include items such as escalators or shared facilities such as bathrooms. Maintenance capex is not directly reflected in increased rent and is commonly used to “maintain” the relevance of an existing building. This amount is often referred to as a percentage of a building’s value. For example, if a building worth $100 million requires maintenance capex of $500,000 per year, it is common to say it requires 0.5% (or 50 basis points) of maintenance capex.
To attract and retain tenants, commercial property owners often provide “incentives” to prospective and renewing tenants. These incentives can take many forms, but are commonly provided as rent-free periods, or contributions to a tenant’s fit-out. The size and form of incentives varies greatly between different property types. Incentives are commonly quoted as a percentage of the total rent to be paid over the tenant’s lease period. For example, if a tenant agrees to a 10 year lease for $100,000 per year, a 20% incentive would mean that $200,000 of benefits are provided to the tenant. Rent, less any incentives is called “effective rent” and in the above example effective rent would be $80,000 per year. Rent excluding incentives is called “face rent”. It is typically face rent that is used to calculate the NOI used in a cap rate.
Whilst not the subject of this article, it is worth noting that lease structures including term and rent reviews, as well as tenant quality are not considered in a cap rate. Buildings with longer leases, higher fixed rent increases and better tenant quality tend to attract lower cap rates than the alternative.
In a past generation, institutional grade commercial property primarily consisted of office, retail and industrial property. Approximate leasing incentive and maintenance capex amounts across these subsectors 15 years ago can be seen in the table below:
| Property Type | A Grade Melbourne CBD Office Building | A Grade Melbourne Shopping Mall | Modern Melbourne Industrial Facility |
| Leasing Incentives | 20% | 0% | 5% |
| Maintenance Capex | 0.5% | 0.5% | 0.3% |
Whilst there are some differences between the amount of cash flow leakage, the difference between property types is not enormous. Whilst industrial properties faced limited cash flow leakages, market rental growth had been extremely low for a long period. It may not have been perfect but comparing cap rates across these property types 15 years ago was not a terrible way to assess relative value.
Beyond any changes to leasing incentives and maintenance capex requirements, today’s listed property sector is much broader than it used to be. Alternative property types such as healthcare, social infrastructure, petrol stations and long WALE sale-and-leaseback properties are all part of the institutional investment landscape. Many of these property types are commonly leased in an owner favourable “triple-net” manner. A triple-net lease means a tenant is responsible for property taxes, building insurance and maintenance capital expenditure across the life of the lease.
A revised table approximating today’s leasing incentives and maintenance capex, including triple-net properties, can be seen below:
| Property Type | A Grade Melbourne CBD Office Building | A Grade Melbourne Shopping Mall | Modern Melbourne Industrial Facility | Triple-net Property |
| Leasing Incentives | 42.5% | 15% | 10% | 0% |
| Maintenance Capex | 0.6% | 0.6% | 0.3% | 0% |
It is clear when comparing the above tables, that the dispersion in incentives and capex has widened materially. In the case of an A grade office building, the gap between the building’s cap rate and its true cash flow yield is vast. The chart below demonstrates this visually for an office building with a 6% cap rate:

As can be seen, the cap rate in no way resembles the true cash flow of owning an office building, with more than half of the NOI received (used in calculating the cap rate) lost to capex and incentives.
Consider the four assets in the above table. In this example, each has a cap rate of 6%. The chart below shows the cash flow yield of each:
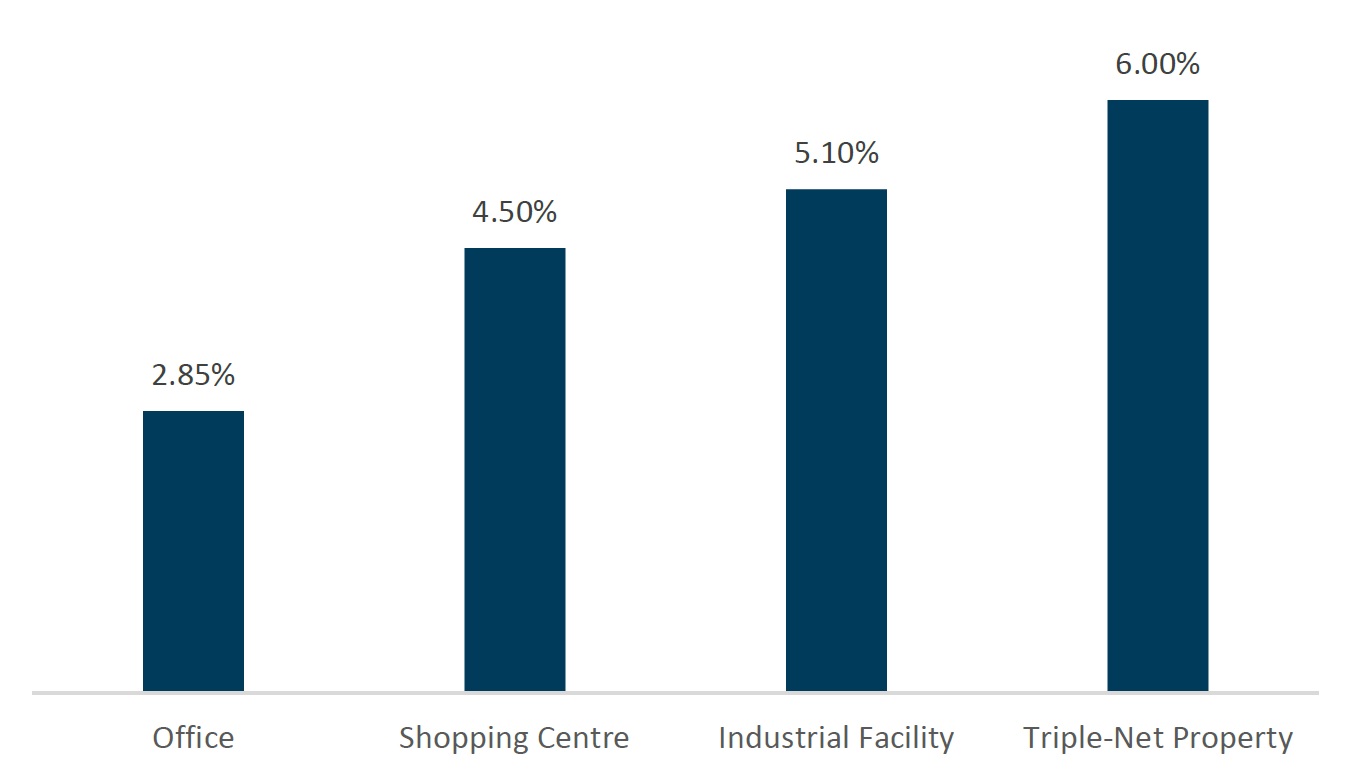
Phoenix actively considers the factors affecting cash flows (among others) and explicitly forecasts longer term capex and incentives that property owners will be required to pay. It is these cashflows that determine value, not next year’s dividend or simply observing a cap rate.
A comparison of Dexus (DXS) and Charter Hall Social Infrastructure REIT (CQE) shows the importance of looking beyond headline cap rates and how this affects how Phoenix manages the portfolio. DXS is predominantly an owner of high quality office properties across Australia. CQE is predominantly an owner of smaller properties leased to childcare providers on triple-net leases. CQE’s cash flow is boosted by a lack of incentives and capex. Childcare property rent is also an income stream heavily supported by the government, with support for funding of the sector a politically bipartisan issue. As at period end, DXS’ office cap rate implied by its share price was greater than 8.3%. CQE’s implied cap rate was more than 6.8%. If one were to merely compare cap rates, DXS would be the more attractive investment opportunity. It however faces significant cash outflows (in the form of capex and incentives) beyond what is measured in a cap rate. As such, Phoenix has held no position in DXS for some time and holds an overweight position in CQE.
Cap rates have the benefit of being simple. In the past they were also a reasonable way to compare property. As incentives and capex levels have diverged between different properties, merely looking at cap rates has become a less appropriate way to consider the relative attractiveness of different properties. By developing a more nuanced understanding of what’s truly “in a cap rate”, investors can make more informed decisions. Remember, the devil is always in the details, and in real estate investing, those details often lie beyond the simple cap rate calculation.
Read more about Cromwell Phoenix Property Securities Fund, including where to locate the product disclosure statement (PDS) and target market determination (TMD). Investors should consider the PDS and TMD in deciding whether to acquire, or to continue to hold units in the Fund.

Stuart Cartledge
In almost every market update and investor discussion Phoenix Portfolios reminds investors that property is an interest rate sensitive sector. All else equal, if interest rates decline the value of property should go up. The opposite is also true, as has been proven recently: when interest rates go up, property prices are likely to decline. This concept is simple, but its impact is not necessarily spread evenly across different types of property. Below we cover the impact of changing interest rates on various types of property and highlight some of the ways our investment process for the Cromwell Phoenix Property Securities Fund responds to a changing environment.

Owning a home is seemingly the goal of almost every Australian. It is ingrained in Australian culture that one should strive to own a home; after all, it is the Australian Dream! A common refrain is “house prices always go up”. This has seemingly been true in most Australian capital cities, but the housing market is, as the name suggests, a market. Prices in a market are determined by demand and supply. This is also true for houses.
Before discussing the demand side of the equation, let’s briefly touch on supply. Many cities across Australia have notoriously challenging property planning regimes. Any proposal to develop new residential housing, or densify existing housing, tend to be faced with local opposition, combined with long and costly planning processes. An example can be seen in one of the portfolio’s holdings, Mirvac Group (MGR), which bought an old hotel in Brunswick, in Melbourne’s Inner North in 2021. Plans to knock down the hotel to build more than 150 apartments are still going through a planning process. At best these apartments will be delivered in 2026, although delays are likely. Since 2011, the number of residential dwellings in Australia has grown at 1.7% per annum1 , with much of that growth taking place on the outskirts of existing capital cities.
As was previously touched on, demand for housing is insatiable. Furthermore, Australia’s population has roughly grown in line with new dwellings and the amount of people living in each dwelling has been consistently decreasing. In a world where supply is limited, what stops prices going up infinitely? The answer is of course people’s capacity to pay. The vast majority of home buyers make use of a mortgage to buy their homes and so the amount that they can afford to borrow, will be very closely linked to how much they are willing to pay for a house. In this context, the impact of changing interest rates should be obvious.
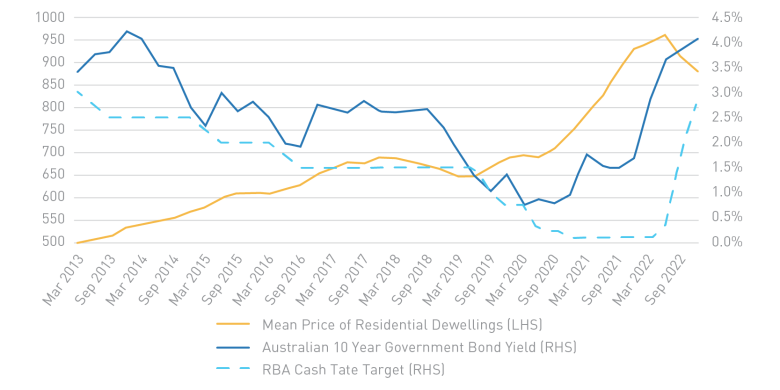 To illustrate this point. The Reserve Bank of Australia’s Target Cash Rate (Cash Rate) has moved from 0.1% to 4.10%. The monthly repayments on a $900,000 mortgage today are equivalent to the monthly repayments on a $1,420,458 mortgage when the Cash Rate was 0.1%. The change in house prices will naturally (inversely) follow changes in interest over time, albeit with somewhat of a lag. This can be seen in the chart on the right-hand side. Note how home prices accelerated when interest rates were at record lows.
Shopping centres, office buildings, industrial properties and other commercial property types may have bigger price tags than your average three-bedroom home, however many of the same dynamics are at play. Like residential property, most commercial property purchases are partly funded with debt. Unlike residential property, where mortgages can commonly comprise 90% of the value of the property, listed commercial property owners in Australia typically employ gearing levels of approximately 30%. Unlike many owner occupiers, commercial property investors require a financial return on their capital. In most cases, this means that debt must be “accretive” to the owner. Put more simply, the cash flow yield of the property should be greater than the interest rate on debt2. A natural relationship that comes from this is that as interest rates increase, the income yield owners require also rises. Assuming the amount of income is stable, this means that the value of the property must go down.
Again, much like residential property, market prices for commercial property are determined by supply and demand. The factors playing into demand are however different to residential markets. Many commercial property investors can, and do, invest across many asset classes. As a collective, their goal is to earn the best return they can in the least risky way possible. To invest in a riskier asset type they naturally require a higher return. An abbreviated list of asset classes and their risk levels can be seen below.

| Asset Class | Risk Level |
|---|---|
| Cash | Very Low |
| Government Bonds | Low |
| Corporate Debt | Low to Moderate |
| Property and Infracstructure | Moderate to High |
| Shares | High |
When interest rates increase, so does the income investors can earn from investing in cash, government bonds and corporate debt. That makes them relatively more attractive. When this happens the demand for property (at the same price as before rates increased) decreases. The return required from property then increases in order to make those returns relatively more competitive with lower risk alternatives.
So, with all the negative impacts of rising interest rates, does this mean investing in listed property is doomed? We do not believe so and we have been managing the portfolio for the current environment. Some ways we can adjust to investing in this environment include:
Buying securities at large discounts – The stock market is forward looking and the market prices changes in interest rates on a daily (even moment-by-moment) basis. In some cases, the market can overreact, leaving great buying opportunities. One such example we have discussed in the past is GPT Group, which ended the quarter trading at a discount of almost 30% to its net tangible asset backing.
Buying higher returning assets – Higher yielding assets are less affected by interest rates than their low yielding counterparts. For example, a 0.5% increase in capitalisation rate for an asset previously trading at 4%, represents a greater than 11% decline in value, while a similar move for an asset with a 7.5% capitalisation rate equates to only a 6.3% decline. Phoenix has invested in GDI Property Group, which owns higher capitalisation rate assets such as offices in Perth. The properties have the added benefit of being valued below their replacement cost, further adding to their relative attractiveness.
Buying assets with higher growth outlooks – When interest rates were at record lows, assets with high levels of growth were priced for perfection. This has moderated in recent times. Industrial property rents are growing at record levels, up 20% year-on-year in some domestic markets (and more than 50% in some foreign markets). In fast moving markets these assets may look optically expensive based on this year’s income yield, however are attractive if one looks forward. Phoenix has increased its stake to industrial property, taking meaningful positions in Goodman Group and Centuria Industrial REIT.
Once more it is worth reiterating that property is an interest rate sensitive sector. When we inevitably say this again in the future, hopefully the information above is useful in explaining what we mean. We are however very cognisant of the impact of interest rates along with many other extraneous factors. We will always strive to buy attractively valued securities and are constantly assessing assumptions and adjusting the portfolio to achieve this goal.
1. Source: Australian Bureau of Statistics
2. This is true in most cases, however many consider accretion to “total return”, which includes capital growth as well as income.
Read more about Cromwell Phoenix Property Securities Fund, including where to locate the product disclosure statement (PDS) and target market determination (TMD). Investors should consider the PDS in deciding whether to acquire, or to continue to hold units in the Fund.