Person typing on a laptop

Research and Insights

Home Research
March 8, 2024

The power of AI in real estate: a paradigm shift

AI has the potential to profoundly change the real estate industry in coming years, and is projected to add up to $275 billion to market values. Indeed, understanding shifts in occupier markets from AI is crucial to optimising allocation decisions and maximising investment returns. This month, Cromwell’s Research and Investment Strategy Manager, Colin Mackay, takes a close look at the utilisation of AI, including how to best understand the risks and ethical concerns around the topic.

View the full report here.

Person typing on a laptop

Research and Insights

Home Research
January 4, 2024

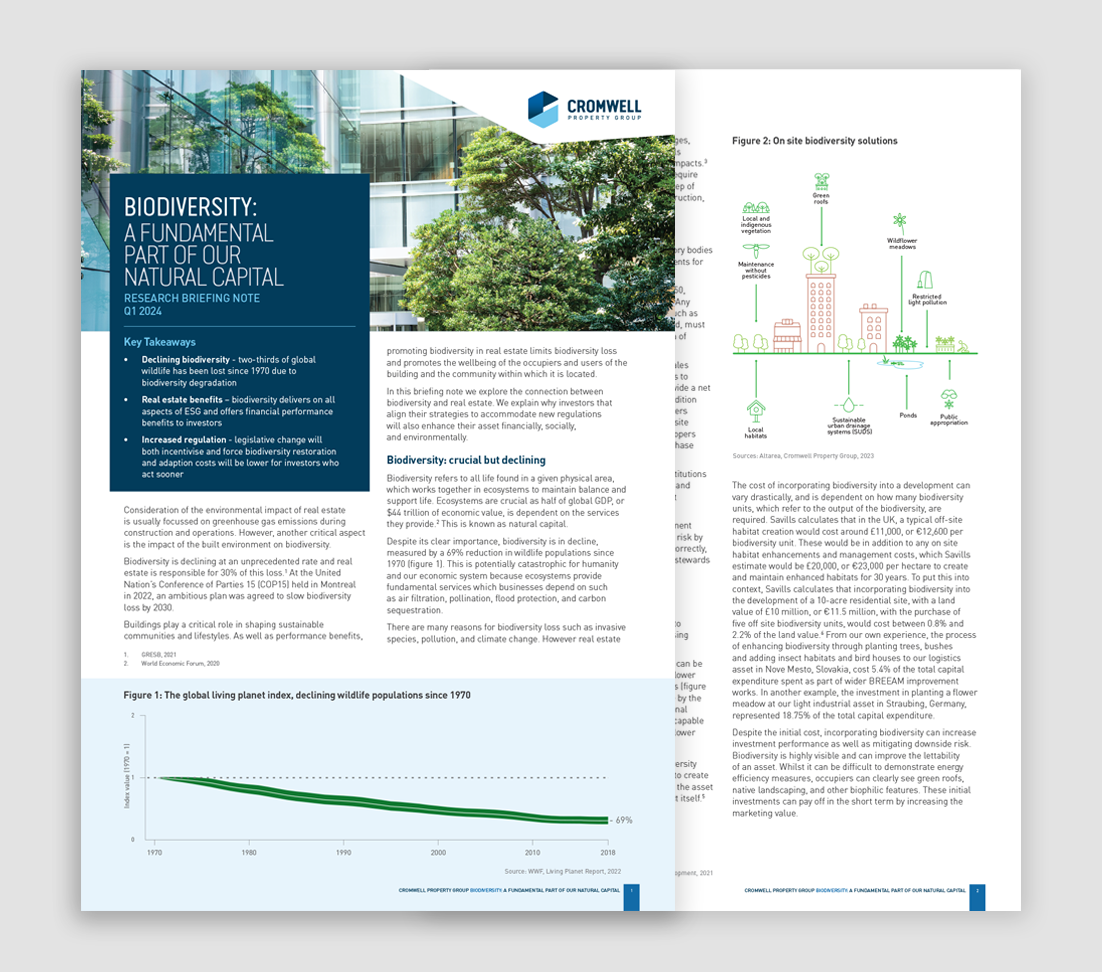
Biodiversity: a fundamental part of our natural capital

Consideration of the environmental impact of real estate is usually focussed on greenhouse gas emissions during construction and operations. However, another critical aspect is the impact of the built environment on biodiversity. In this briefing note we explore the connection between biodiversity and real estate. We explain why investors that align their strategies to accommodate new regulations will also enhance their asset financially, socially, and environmentally.

View the full report here.


Person typing on a laptop

Learn

Home Research
October 11, 2023

Redefining the office flight to quality: A Sydney CBD case study

Colin Mackay, Research & Investment Strategy Manager, Cromwell Property Group


“Flight to quality” has been the real estate industry’s phrase of the year, particularly as it pertains to the office sector. While Cromwell agrees that a flight to quality is occurring and will continue to play out over the medium-term, our opinion of what that flight actually is – and indeed our definition of quality – is somewhat contrarian.

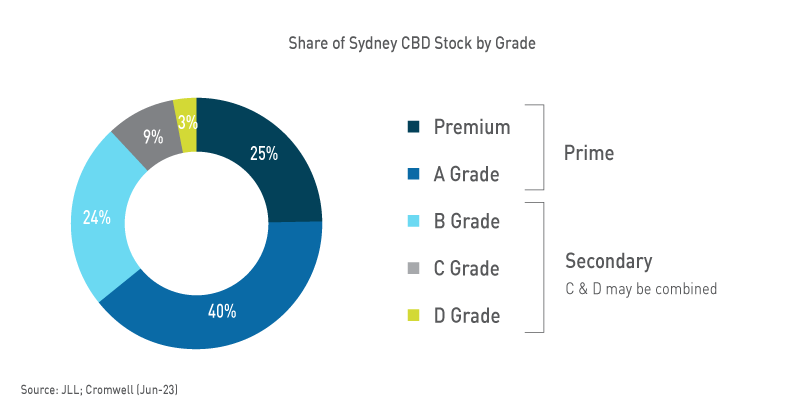
Quality has become synonymous with Premium – the top grade of office buildings. These buildings are modern developments with the largest floorplates, most internal amenity, and luxurious finishes and fitouts – and which naturally charge the highest rents. While this type of asset is an important part of the market, it’s worth assessing whether the popular narrative fits all the facts.

Are occupiers flocking to Premium assets at the expense of Secondary stock? Does the top-end of town hold all the cards?

Net absorption is important but doesn’t tell the whole story


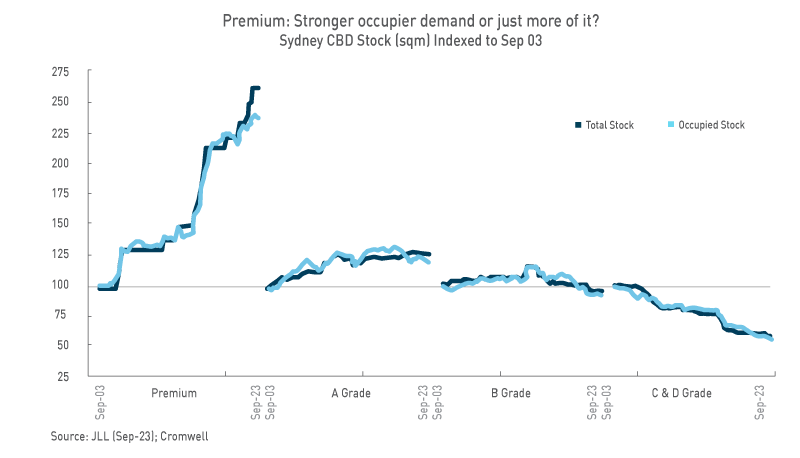
Net absorption is the metric often cited as evidence of the flight to (Premium) quality. In the Sydney CBD, Premium stock has recorded the strongest net absorption over the last 20 years at around +624,000 square metres (sqm), an increase in occupied stock of +137%. A Grade’s net absorption (+270k sqm) has been the second strongest over that time period, with the amount of occupied space increasing +18%. On face value, it’s easy to see why the “Premium is best” narrative has emerged – but there’s more to the story!

Premium has also seen the largest increase in total space.


Net absorption is the change in occupied (leased) space over a given period (often a quarter or year), represented in square metres. It is calculated by subtracting the amount of occupied space at the start of a period from the amount of occupied space at the end of a period. Positive net absorption means the amount of occupied space has increased, while negative net absorption represents a decrease.


Growth in occupied space is an expected by-product of the substantial increase in supply. On the other side of the coin, B Grade has recorded negative net absorption but also a decrease in total space – occupiers can’t lease space that doesn’t exist.

This dynamic is often seen in the lower grades as buildings are “withdrawn” (removed) from the market through conversion to different uses (e.g. residential). When we consider that rents are a function of demand and supply, it becomes clear that looking only at net absorption provides an incomplete picture of market conditions – we also need to look at the supply side of the equation.

On face value, it’s easy to see why the “Premium is best” narrative has emerged – but there’s more to the story!

Vacancy paints a different picture


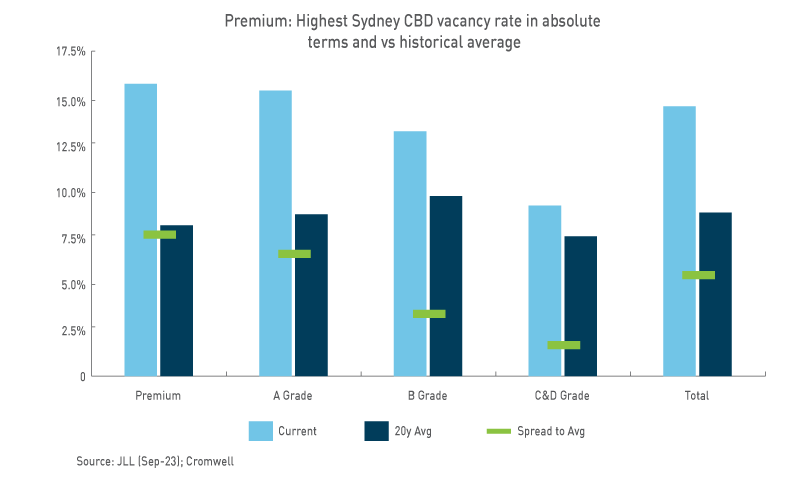
Vacancy rates highlight a deterioration of demand relative to supply at the top end of the asset grade spectrum. In the Sydney CBD, Premium has the highest vacancy rate in absolute terms and when compared to its historical average.

B Grade has proven more resilient from an occupancy perspective, with vacancy actually decreasing over the last year.


Despite elevated vacancy, Premium’s net effective rental growth has outpaced A Grade and B Grade over recent quarters. There are a couple of potential explanations for this counterintuitive result.

Time lags: It takes time for changing conditions to be grasped by market participants, for negotiations to be had and leases signed. Premium had the lowest vacancy rate until mid-2022, with its main occupiers adopting a “wait-and-see” approach to space decisions through the pandemic. Now, Premium occupiers are handing back space and driving vacancy higher, but current rental outcomes are reflecting the tight conditions of prior quarters.

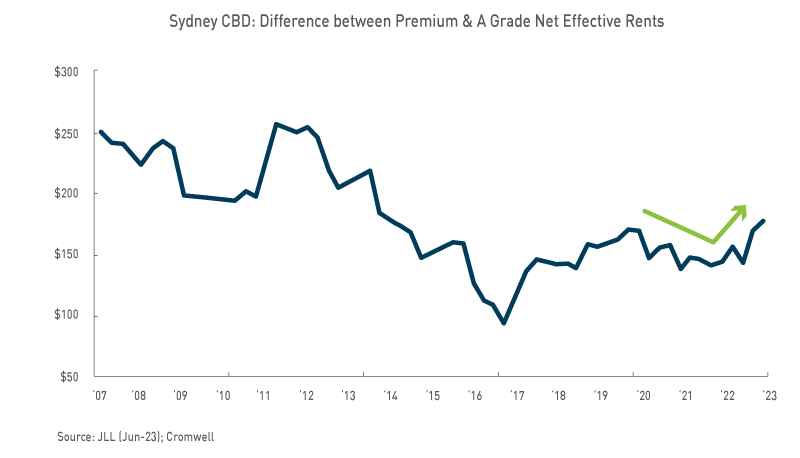
Affordability: The spread between Premium and A Grade rents narrowed over 2021-22 as Premium incentives increased. Industry feedback suggests occupiers have taken advantage of the relative affordability to upgrade, taking up less space but at a higher rate per sqm. This is positive for market rental growth but less so for income growth, given the occupancy effect. We expect Premium upgrading to run out of steam as affordability worsens, with the spread recently increasing to its widest level since 2014.


Incentives are financial ‘sweeteners’ offered by landlords to encourage tenants to lease space. Common incentives include contributions to tenant fitout costs, rent-free periods, and rental abatements where the amount payable is reduced for a period of time. The rent received by a landlord after incentives are accounted for is referred to as an “effective” amount.


In any case, for investors, there’s limited value in knowing today’s performance – what really matters is the future.

Good things come in small packages


In our view, it will be difficult for Premium stock to maintain the current pace of rental growth, with A Grade stock likely to outperform over the medium-term due to lower vacancy, a less substantial supply pipeline, and favourable occupier trends.

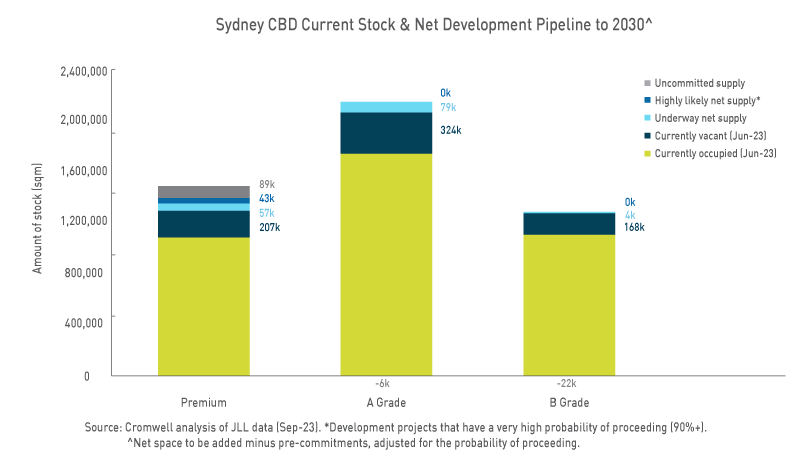
Cromwell estimates there are 265k sqm of Premium space in the Sydney CBD which will need to be leased in the near term based on space currently vacant or completing by the end of 2024. This “baked in” amount is equivalent to 19.7% of current Premium stock. Future developments may deliver new supply to the market post-2024, however we only consider 43k sqm as highly likely on a probability-adjusted basis.

A Grade has a larger amount of space requiring leasing (403k sqm); however, it is smaller as a proportion of existing stock (18.8%). Unlike excess B Grade stock which may be withdrawn from the market via change of use, the only feasible option for Premium space is absorption via leasing. On this front, the Premium end of the market faces some challenges.

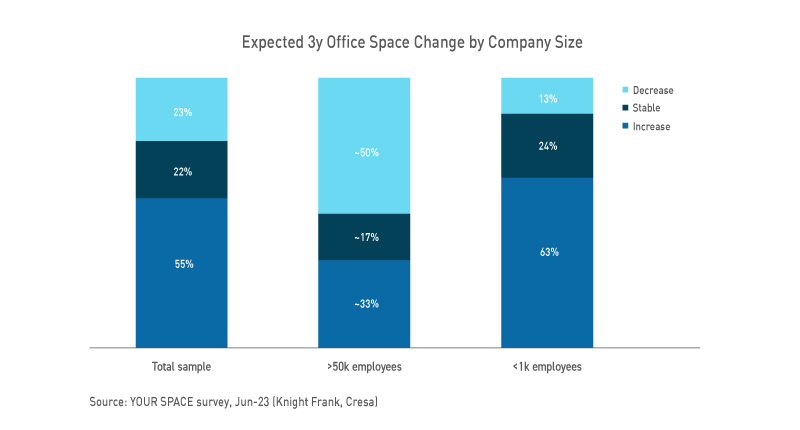
Space contraction impacts from work-from-home are being felt most keenly by assets with large floorplates. These buildings are expensive to divide into smaller tenancies and typically cater to the largest occupiers. Research1 points to an inverse relationship between occupier size and office usage, which is then being reflected in organisations’ plans to expand or contract their office footprint. The industries that predominantly occupy Premium buildings (financial services, professional services, tech) also demonstrate a lower propensity to use the office post-COVID.

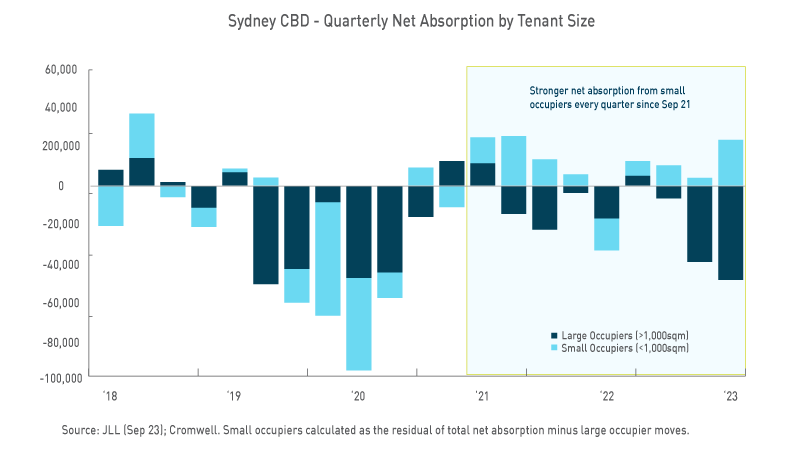
Australian leasing data corroborates the research findings. Net absorption has been far stronger across smaller (<1,000sqm) occupiers than large occupiers. The tendency to expand has also been far more positive, with smaller occupiers on average expanding their footprint by ~20% (national leasing deals from 1Q21 to 2Q22) compared to an average contraction of ~13% for occupiers larger than 3,000sqm2.

We believe the in-office bias of smaller occupiers versus larger occupiers reflects the nature of work typical across these organisations. Bigger firms are more regimented and siloed, with large administrative “back office” functions that predominantly perform focused tasks individually. These firms may have also invested more heavily in digital collaboration tools which facilitate remote work across a more geographically dispersed workforce. Smaller firms are more dynamic, with employees wearing multiple hats and undertaking work that tends to favour face-to-face interactions. Regarding smaller firms’ space expansion, this may be linked to their much stronger headcount growth through the pandemic. Businesses with 5-199 employees saw employment growth across the main office-using industries of 4.6% p.a. from Jun-19 to Jun-22, compared to -0.2% p.a. for businesses with 200+ employees3.


One of the arguments often made against exposure to smaller occupiers is that they are riskier than large occupiers, but the data shows this isn’t the case. While very small firms do fall over more often, those with 20-199 employees have nearly identical survival rates to firms with 200+ employees. The smaller occupier bracket is also broader and more diversified, with office-using businesses spanning many industries. By comparison, the large firm bracket is dominated by financial and professional services. Overexposure to large occupiers can also increase the risk that a significant portion of an asset becomes vacant at a single point in time, rather than being spread over a manageable leasing horizon.

Price doesn’t always equal quality


Conflating luxury with quality ignores the needs of many office occupiers. While the largest companies attract the most attention, most office-using Australian businesses are small and medium-sized enterprises (SMEs)4. With cost being the top driver of real estate decisions5, these SMEs are in the market for a Toyota, not a Rolls-Royce with all the extras. They want the highest quality office, in the best location, but within their price bracket. So then, what is “high quality” office? Ultimately, it’s space which meets the needs and preferences of its target occupiers.

Some occupier preferences are timeless and will persist no matter how workstyles and space usage evolve, for example availability of natural light, convenient access to transport and plenty of nearby amenity (e.g. dining and gyms). These are hygiene factors valued by occupiers of any industry or size.

The pandemic has rendered some requirements less important. Floorplate size has historically been a measure of quality and is one of the criteria that determines whether a building is considered Premium or a lower grade. But with occupiers’ office usage shifting towards collaboration and social connectivity, a smaller floorplate can create more incidental interactions and a better ‘buzz’ in the office. While there is a minimum viable size in terms of efficiency and layout, we’re finding bigger isn’t always better in the eyes of occupiers.

Other requirements have increased in importance as occupiers shift to a new way of working. A greater level of embedded technology is expected, to ensure a flexible working model can be facilitated. Greater diversity of spaces is needed to support focused work, collaboration, and flexibility, with implications for building layouts and landlord-led fitouts.
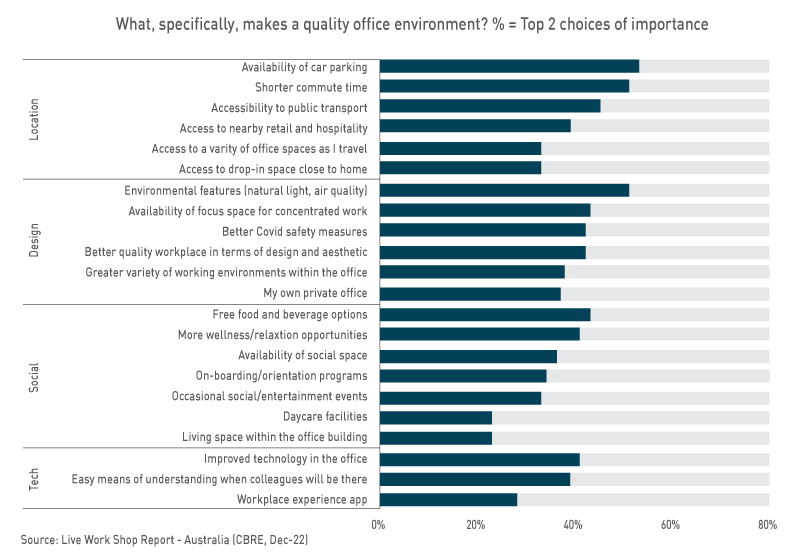
Sustainability also continues to increase in importance, with a wider array of organisations focusing on both the financial and social benefits it can provide, including staff attraction and retention.

Greater diversity of spaces is needed to support focused work, collaboration, and flexibility, with implications for building layouts and landlord-led fitouts.

Not always the more sustainable choice


The preference for sustainable space is becoming more tangible and spans a variety of stakeholders, including end users, occupiers, and investors. Premium buildings often have the highest sustainability ratings (e.g. NABERS), something which is used to support the view that occupiers will increasingly gravitate to these assets over time. But again, these ratings don’t tell the whole story.

While new Premium assets are top performers from an operational emissions perspective (e.g. energy usage), production of building materials and construction activities are the largest producers of embodied carbon emissions6. As the grid decarbonises, embodied carbon’s share of built environment emissions is expected to increase from 16% in 2019 to 85% by 20506 – in the pursuit of net zero, minimising the demolition of existing buildings and the construction of new ones will become far more important than building-specific energy efficiency. As the importance of embodied carbon becomes more well known and stakeholders adopt a whole-of-life view of emissions, newly built Premium assets may not be considered the greener option.


Embodied carbon: the emissions generated during the manufacture, construction, maintenance and demolition of buildings – Green Building Council of Australia (GBCA)


Is this only a Sydney theme?

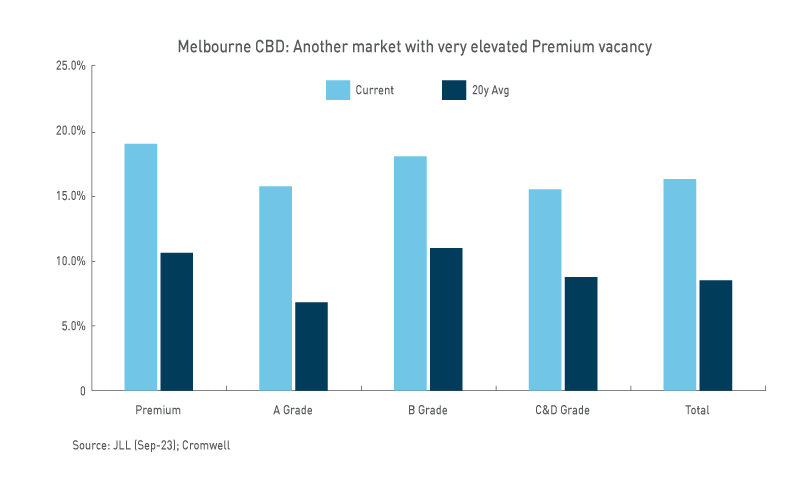
While this paper has focused on the Sydney CBD for simplicity and brevity, we see the same dynamics playing out in Melbourne. The CBD Premium vacancy rate is almost 19%, and Cromwell forecasts the amount of Premium stock will increase by 15% by 2026 based on new supply currently under construction. The same occupier trends are also occurring, with small occupiers recording positive net absorption of over +23k sqm since Dec-19, compared to negative net absorption of almost -241k sqm for large occupiers.

We believe the flight to quality is occurring across all grades – not just Premium – as occupiers seek space that is well-located, offers high amenity, and enables a flexible approach to working, but within their price bracket.

Look beyond the headline


“Flight to quality” has been a popular theme in the office sector. While positive net absorption has been used to support the notion that Premium buildings are outperforming lower grade assets, the metric can’t be looked at in isolation. Investors gain a more comprehensive understanding of market conditions by also considering other factors such as vacancy, supply impacts and occupier demand trends. We believe the flight to quality is occurring across all grades – not just Premium – as occupiers seek space that is well-located, offers high amenity, and enables a flexible approach to working, but within their price bracket. In our view, the A Grade segment of the market is best-positioned as it occupies an affordability-quality sweet spot, supported by ongoing demand from smaller occupiers and a smaller supply pipeline.


  1. Empty spaces and hybrid places (McKinsey, Jul-23); U.S. Office Occupier Sentiment Survey (CBRE, May-23)
  2. Australian Office Footprint Analysis (CBRE, Oct-22)
  3. ABS (May-23); Cromwell. Main office-using industries includes: Information media and telecommunications; Rental, hiring and real estate services; Professional, scientific and technical services; Administrative and support services; Education and training (private). Financial services employment breakdown is not published by the ABS.
  4. SMEs defined as businesses with 5-199 employees, within the same office-using industries as previously defined.
  5. What Occupiers Want (Cushman & Wakefield, Jul-23)
  6. Embodied Carbon & Embodied Energy in Australia’s Buildings (GBCA; thinkstep-anz, Aug-21)
Person typing on a laptop

Learn

Home Research
September 14, 2023

Industrial: Still delivering the goods

Colin Mackay, Research & Investment Strategy Manager, Cromwell Property Group


Industrial has been Australian real estate’s star performer for a decade, notching up an annualised 10-year return of 14.2%1. While the rate of new supply has increased, the availability of space has been unable to match pace with surging demand. Australia has become the lowest vacancy industrial market in the world2, contributing to record rental growth of almost 25% in the year to March 20233. The sector’s strong momentum continues, and the outlook is bright, as several long-term tailwinds drive demand.


E-commerce

The shift in retail activity from physical stores to digital channels drives demand for industrial space in several ways:

  • warehouse space is needed to store inventory which would have otherwise sat in a store;
  • e-commerce tends to offer a wider range of products, rather than the curated selection that a specific retail store might be limited to, necessitating more storage space; and
  • goods purchased online have higher rates of return, and space is needed to handle the reverse logistics.

Increased storage and space needs mean pure-play e-commerce requires three times the distribution space of traditional retail4. Customer preferences are primarily driving the shift to online, particularly as demographic change sees ‘digital natives’ become the dominant consumer segment. As scale and investment lead to greater efficiencies and profitability, the shift may gain another momentum boost.

E-commerce in Australia is following a similar trajectory to Great Britain – it is on track to hit a market share of 20% of all retail sales by 2030 despite growth slowing from pandemic peaks. With 70,000sqm of logistics space needed for every incremental $1 billion of online sales5, e-commerce alone could generate industrial space demand of almost 600,000sqm p.a. over the next seven years6.

Supply chain resilience

As explained in last year’s Supply Chain Adaptation paper, one of the most immediate and lasting impacts of the pandemic has been supply chain disruption, with erratic swings in demand exacerbated by congested ports and border restrictions. The pendulum is now swinging from the prevailing ‘Just-In-Time’ supply chain philosophy, where goods are shipped on demand and arrive just before they are needed, back towards a ‘Just-In-Case’ approach. Under this approach, higher volumes of inventory and production are stored and undertaken locally, where it can be better guaranteed.

Supply chain experts estimate the majority of Australian occupiers are currently holding approximately 30% more inventory compared to pre-pandemic levels7. While this degree of buffer will likely decrease as supply chain disruptions ease, a full return to previous inventory levels is unlikely, meaning more warehouse space will be needed on an ongoing basis for storage.

Online-share-article


Infrastructure

Infrastructure development is a key priority in Australia as we contend with ongoing urbanisation and densification, along with surging population growth. Across the 2022-23 Budgets, $255 billion in government expenditure was allocated to infrastructure for the four years to 2025-26, an increase of $7 billion or 2.7% compared to 2021-229. In dollar terms, NSW has the highest allocation to infrastructure ($88 billion), while QLD saw the largest increase on the previous year ($5.7 billion). The three East Coast states of NSW, Victoria, and QLD account for 83% of the committed infrastructure funding.

Budget-infrastructure

Infrastructure investment stimulates demand for industrial real estate in a couple of ways. As new infrastructure is built, congestion and connectivity improve, lowering transport and operating costs and allowing more efficient movement of people and goods. This helps businesses to grow and increases the supportable population base. More activity and more people, mean more demand for industrial space to power the ‘engine room’ of a bigger economy. The more direct source of infrastructure-related industrial demand occurs during a project’s construction phase, as space is needed to manufacture, assemble, and store materials and components.

Customer proximity

The time it takes to reach the customer is of critical importance in modern supply chains. Customers increasingly expect products to arrive faster, more flexibly, at the time promised, and with lower delivery costs. While not a driver of aggregate space demand, the focus on customer proximity does contribute to stronger rental growth for well-located properties.

Transport accounts for 45-70% of logistics operator costs compared to 3-6% for rent10. This low proportion of cost means well-located industrial assets with good transport access and proximity to customers have long runways for rental growth, as occupiers prioritise lower (cheaper) transport times – an up to 8% increase in rent can be justified if a location reduces transport costs by just 1%.

Share-logistics


But what about supply risk?

While the demand drivers for industrial are clear, the supply-side response is just as important in determining asset performance. In previous cycles, downturns have arisen from excess speculative development creating too much stock and dampening rental growth. But there are several reasons why the sector is insulated from a supply bubble this time around. Firstly, labour and materials shortages are making it challenging to physically build new assets, even though development is commercially attractive. Secondly, there is a lack of appropriately zoned, serviced land available for development. While land is becoming available farther out from metropolitan centres (e.g. Western Sydney Aerotropolis), this land is not appropriate for many occupiers or uses which require closer proximity to customers. It will also take time for this land to become development-ready, due to planning, infrastructure (e.g. road widening), and utility servicing (e.g. water connection) delays. Finally, the sector has matured and become more ‘institutional’ over the current cycle, with a shift in ownership from private capital to large, sophisticated owners and managers. Institutional owners take a more cautious approach to development, contingent on higher levels of tenant pre-commitment, reducing the risk of a speculative supply bubble. These factors will make it difficult for supply to keep pace with – let alone surpass – demand.


Demand story remains intact

Industrial has been the “hot” sector in recent years, and it’s reasonable to question whether it’s been squeezed of all its juice. The pandemic provided a boost to many of industrial’s demand drivers (e.g. e-commerce) and introduced new ones (e.g. supply chain resilience). While these tailwinds have abated somewhat from their pandemic highs, they continue to contribute to a positive demand outlook. Arguably more importantly, the supply response remains constrained by shortages (e.g. labour/materials/land) and delays (e.g. planning), and it will take several years for the sector to return to a more normal supply-demand balance. As a result, Cromwell expects healthy rental growth to be a key driver of industrial returns, and for the sector to remain attractive despite expansionary pressure on cap rates.

Footnotes

1. The Property Council-MSCI Australian All Property Digest, June 2023 (MSCI)
2. Australia’s Industrial and Logistics Vacancy 2H22, December 2022 (CBRE Research)
3. Logistics & Industrial Market Overview – Q1 2023, May 2023 (JLL Research)
4. What Do Recent E-commerce Trends Mean for Industrial Real Estate?, Mar-22 (Cushman & Wakefield Research)
5. Australia’s E-Commerce Trend and Trajectory, September 2022 (CBRE Research)
6. Projection based on historical 15-year retail sales growth of 4.0% p.a. (Cromwell, Jun-23)
7. Is ‘Just-in-Time’ a relic of a time gone by in Australia?, March 2023 (JLL)
8. Global Reshoring & Footprint Strategy, February 2022 (BCI Global)
9. Australian Infrastructure Budget Monitor 2022-23, November 2022 (Infrastructure Partnerships Australia)
10. 2022 Global Seaport Review, December 2022 (CBRE Supply Chain Consulting)

About our managed commercial property funds

Our suite of funds offers access to unlisted property trusts, ASX-listed Real Estate Investment Trusts and internationally listed small cap securities, providing different methods of investing in commercial property and diversifying your portfolio.

Person typing on a laptop

Learn

Home Research
July 18, 2023

Ignore the noise: Australian office isn’t dead (or dying)

Colin Mackay


sydney-harbour

The future of offices in a post-pandemic world continues to be a topic of robust conversation.

Arguably, most airtime on the subject has been given to dramatic statements like “expect the death of the office” – perhaps recycling articles from the past decade that incorrectly asserted a retail apocalypse was nigh! The reality is that, as retail has adapted to the internet age – and survived – so too will office spaces adapt to these changing conditions.

It can be easy to fear the worst, especially as reports of landlords handing keys to the bank; assets sitting unoccupied; and valuations declining 80% take up the front page of newspapers.

It’s important, however, to understand that these events have been limited to the US, a challenged market with different financial, social, and real estate context. The outlook for office in Australia is markedly more positive for several reasons.


Higher office occupancy

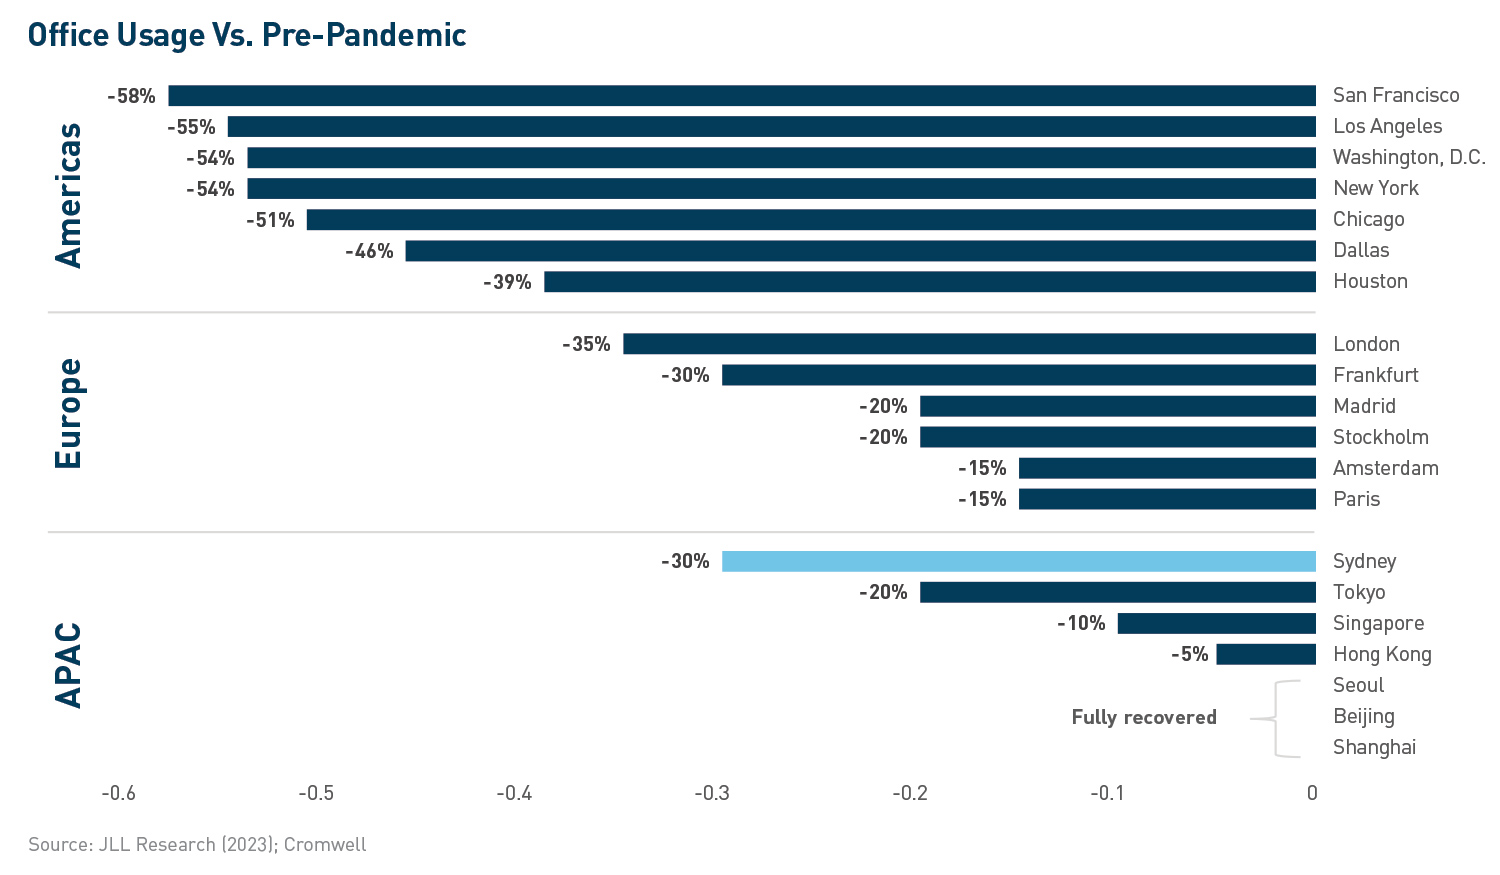
The return to the office has been strongest in Asia-Pacific, where office occupancy is sitting at 70-100% of pre-pandemic levels1. Workers in North America have been the most reluctant to come back to CBDs (45-65%), with Europe (65-85%) splitting the two regions. At the individual market level, the likes of Shanghai and Beijing are back at pre-pandemic occupancy; Sydney has recovered to 70%; London is a bit weaker at 65%; and the major US cities are significant laggards with office-based work still below half of pre-pandemic levels in Chicago (49%), New York (46%), and San Francisco (42%).

graph_officeusage

Propensity to return to the office appears to be driven by a number of factors, including cultural expectations (e.g., Tokyo/Seoul); industry composition (e.g., finance vs tech); and ease of commute (e.g., rapid transit vs LA traffic). While commute time is highlighted by workers around the globe as the most important driver of returning to the office2, another critical factor is the micro-location of each office building. In addition to influencing commute time, different locations can vary significantly in terms of crime and safety risks, amenity (e.g., restaurants), and environmental desirability (e.g., proximity to water/green spaces).

Australia measures up very attractively on these characteristics, offering reliable rapid transit, exceptional proximity to desirable environmental features, a high density of quality amenity integrated throughout the CBDs, and very low rates of crime. The return to the office will likely gather more steam in the coming months as large employers mandate a minimum number of days in the office per week, as announced recently by NAB and CommBank. However, over the long-term, locations and assets which can attract employees through choice rather than coercion will outperform.

/graph_ridershipnumbers

graph_workpointdensity


Expanding space requirements

One of the forces expected to offset the impact of remote work is the expansion of workspace ratios – the amount of office space per employee. Forty years ago, in the days of private offices, Australian offices had more than 20 square metres (sqm) of space per employee. Over time, as occupiers sought more “bang for their buck”, desks became more tightly packed together and the corner office was sent to the scrap heap.

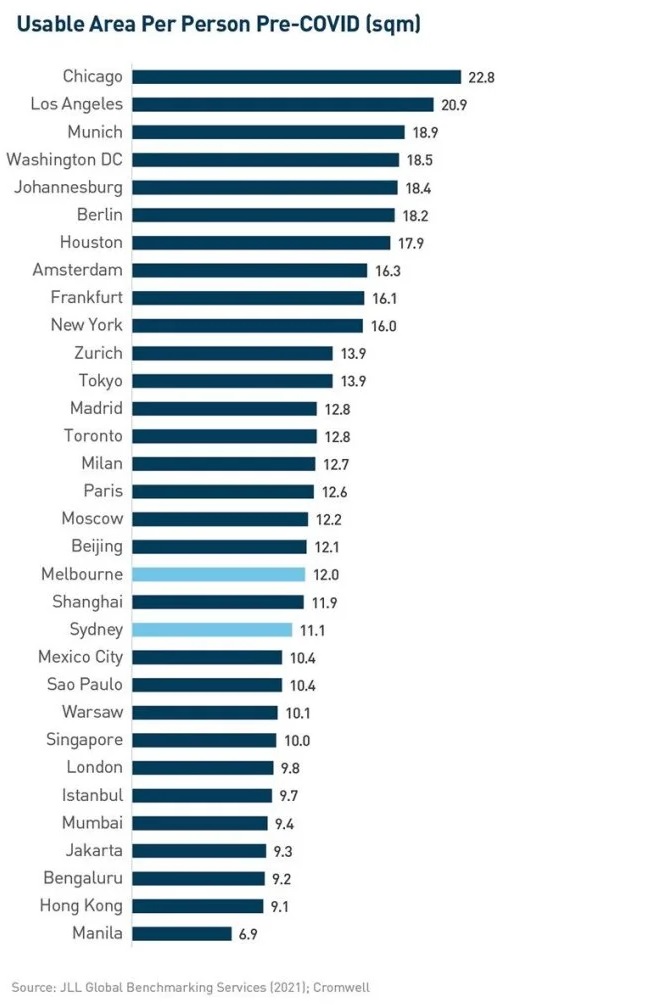
The result has been densification of the workplace, with the pre-COVID workspace ratio sitting at 11.1 sqm per employee for Sydney and 12.0 sqm for Melbourne3.


The experience of the pandemic has initiated a shift in the purpose of the workplace and workstyles. The office is increasingly becoming a place for collaboration and social connection rather than focus work, meaning a greater need for meeting, gathering, and collaboration spaces. There is also a need to lower density and make workplaces more comfortable from an employee wellbeing and retention perspective, as employers fight for top talent. Studies have shown that inadequate privacy and space is the dominant cause of workspace dissatisfaction4.

The office is increasingly becoming a place for collaboration and social connection.


In the US, markets such as Chicago and Los Angeles have ratios above 20 sqm per employee, with even New York at 16.0 sqm3. The pandemic-initiated evolution of the work environment can be achieved in these markets by simply recalibrating (and even shrinking) existing footprints.


Contrast this environment with Australia, where workspace ratios are below the global average of 13.3 sqm3 and potential space efficiencies are limited. In this market, the recalibration will likely require additional space, providing a source of demand and limiting the amount of rent-dampening excess stock.


graph_bankloanexposure

Appropriate financing

Earlier in the year, some high-profile office defaults in the US by Brookfield, and a PIMCO-owned landlord, kicked off concerns about a real estate debt crisis. Risks are certainly elevated in the US, given the aforementioned demand challenges, which will pressure serviceability and put significant downwards pressure on valuations. While pockets of distress may emerge in Australia, the likelihood of a widespread crisis is much lower. Banks remain confident in Australian commercial real estate, increasing their exposure by 5% in December 2022 compared to a year ago5. Loan quality has also remained stable, with non-performing commercial property loans as a share of total exposure unchanged at 0.5%.

Most importantly, the office demand outlook in Australia is much more positive. Solid cashflow will support serviceability as debt rolls onto higher interest rates and help prevent valuations from declining to the extent that is expected in the US. Australia’s lending market is also well regulated, diversified, and strong, and doesn’t face the concentrated exposure or balance sheet issues that smaller regional banks in the US have been contending with throughout 2023.

Additionally, Australian gearing is more conservative with typical loan-to-value (LTV) ratios pre pandemic of 55%, compared to 72% for the US6. While lending conditions have tightened somewhat over the last six months (LTVs now 50%), the US has seen significant tightening (to 57%), contributing to a significant funding gap which will need to be plugged with discount-seeking capital.

The final word

Office is going through a period of change, and assets need to evolve to meet the needs of post pandemic workstyles. While there will be challenges – and opportunities – as a result, the current narrative erroneously extrapolates issues from offshore to the domestic market.


Australian office is well-placed to contend with increased rates of remote working and tighter capital markets given its resilient demand drivers, quality of stock, and sensible financing arrangements. Skilled managers with the expertise to identify underappreciated assets and adapt them to the future of work will continue to deliver strong investment returns.


Footnotes

1 The Future of the Central Business District, May 2023 (JLL)
2 The Global Live-Work-Shop Report, November 2022 (CBRE)
3 Benchmarking Cities and Real Estate, June 2021 (JLL)
4 A data-driven analysis of occupant workspace dissatisfaction, August 2021 (Kent, Parkinson & Kim)
5 Quarterly authorised deposit-taking institution property exposures, December 2022 (APRA)
6 Analysing the Funding Gap: Asia Pacific, May 2023 (JLL)

About our managed commercial property funds

Our suite of funds offers access to unlisted property trusts, ASX-listed Real Estate Investment Trusts and internationally listed small cap securities, providing different methods of investing in commercial property and diversifying your portfolio.