June 2024 direct property market update - Cromwell Funds Management
Person typing on a laptop

Learn

Home June 2024 direct property market update
July 22, 2024

June 2024 direct property market update

Economy

Financial markets remained volatile over the quarter, reflecting participants’ keen focus on the outlook for interest rates. A major event during the quarter was the release of the 2024-25 Federal Budget on 14 May, with the state and territory budgets also released over the course of May and June1. The Budget was slightly more accommodative and stimulatory than expected, spearheaded by a $300 per household electricity rebate and additional Commonwealth rent assistance. Many of the states followed suit, offering cost-of-living supports such as further electricity rebates, public transport fare reductions, fee indexation freezes (e.g. vehicle registration), and vouchers for families.

Federal and state governments felt pressured to act, given the ongoing squeeze on households from higher interest rates, tax bracket creep, and inflation. Retail spending continues to record very weak levels of growth, while the latest consumer sentiment print remained in deeply pessimistic territory2. More broadly, economic growth has fallen to its lowest annual pace since 1992 (excluding the pandemic), as per the March National Accounts (released June).


The key question – which will only be answered in time – is what impact the Budget measures will have on inflation, which is not slowing as quickly as the RBA had forecast? Headline inflation will be lowered by the subsidies, which should help slow inflation by reducing administered prices (i.e. CPI-linked costs). The lower headline rate may also help keep inflation expectations anchored to the RBA’s target band. On the flipside, headline inflation will get a bump in 2025 when the subsidies unwind, potentially having the opposite effect. Spending power will also be increased, with the net outcome dependent on households’ propensity to either spend or save the extra cash. Categories such as clothing could absorb additional spending without adding to inflation pressures given the spare capacity which is emerging in discretionary parts of the economy. Additional spending on supply-constrained essentials, such as housing, would be more likely to elicit an inflationary response.

Annual_Inflation_May24

Office

Divergence in performance between markets continues to be a dominant theme in office. Analysis of JLL Research data indicates national CBD net absorption of almost +8,000 square metres (sqm) was recorded over the quarter. Perth CBD (+12,000sqm) recorded the strongest net demand while Melbourne CBD struggled (-27,000sqm). The weakness in Melbourne was driven by A Grade stock, the Western and Eastern Core precincts, and small tenants occupying less than 1,000sqm. Small tenants accounted for 90% of the space contraction, an anomaly compared to other markets and the post-COVID trend.


Weaker space demand and elevated levels of new stock completions led to material vacancy rate increases in the Sydney and Melbourne CBDs. These markets outweighed the vacancy decline observed across the smaller markets, causing the national CBD vacancy rate to increase from 14.7% to 15.4%. Further illustrating the divergent performance by market, Brisbane CBD is currently sitting at its lowest vacancy rate since 2012, while the Sydney and Melbourne CBDs are at their highest vacancy rates since the mid-90s.

Total_vacancies_June24

Prime net face rent growth (+1.0%) matched the average quarterly pace of the past three years. Reflecting its favourable supply-demand conditions, Brisbane CBD was the standout market recording growth of +1.8%. Brisbane also saw prime incentives decline by -1.1%, while the other CBD markets were largely unchanged. These movements resulted in strong net effective rental growth of +3.4% for Brisbane CBD, with Melbourne CBD the weakest performer for the fourth consecutive quarter.


Capital markets continue to thaw, leading to improved
price discovery and narrower bid-ask spreads. National CBD average prime yields expanded 33bps over the quarter, taking total expansion to 182bps since the 2022 peak in values. Transaction volume for this quarter totalled
$2.7 billion, representing the most active quarter since Q3 2022. Sydney CBD accounted for nearly 60% of activity, double its average share over the last decade. Mirvac’s sale of a ~66% stake in the 55 Pitt Street development to Japanese investor Mitsui Fudosan was the main transaction, supported by the 50% sale of 5 Martin Place to an existing co-owner. There was also meaningful transaction activity in the Brisbane CBD, being the only other market where volumes exceeded the quarterly average of the past five years. This was headlined by Quintessential’s acquisition of 240 Queen Street, which took more than a year to close.

Retail

There was little movement in rents over the quarter. According to JLL Research, net rents were unchanged across large discretionary shopping centres (Regionals). Growth in convenience-oriented centres (Sub-Regionals and Neighbourhoods) was slightly more positive, averaging +0.3%. This was due to very strong growth in South East Queensland, where Sub-Regionals and Neighbourhoods both recorded quarterly growth of +1.7%.

Positively for Regional centres, the vacancy rate was largely unchanged over the quarter and is in line with the 10-year average. Conditions are particularly strong across South East Queensland and Adelaide Regionals, where the vacancy rate is 1.6% and 1.7% respectively. A weaker vacancy result was recorded across Sub-Regionals and Neighbourhoods, with most markets sitting above historical average levels.

After a very quiet first quarter, transaction volume returned to a healthy level over the three months to June. Activity was headlined by the sale of Stockland Glendale (to IP Generation) and a 50% stake in Westfield Tea Tree Plaza changing hands from Dexus to a Scentre Group/Barrenjoey partnership. While Sub-Regionals represented the greatest share of transaction volume, activity was also solid across Neighbourhoods and Large Format centres. Average yields were unchanged across the quarter.

Industrial

According to JLL Research, gross occupier take-up rebounded from the soft first quarter to total just over 700,000 sqm. While leasing activity has slowed from pandemic highs, on a rolling 12-month basis it is still running at a faster pace than any period pre-2021 (data back to 2007). The main driver of weaker take-up is Retail & Wholesale Trade, potentially reflecting cautiousness from occupiers in the face of weak retail sales, together with a ‘pause’ to expansion after substantial take-up during the pandemic. Manufacturing continued to outperform, recording gross take-up 10% higher than its 5-year average, with activity particularly strong in Melbourne and Perth. Construction also saw an elevated quarter of activity but remains a small proportion of the industrial market.


Rental growth remains above the long-term average rate despite a weakening of demand relative to supply. Land constrained precincts such as the Brisbane Trade Coast and South Sydney recorded quarterly rental growth of around 5%, with Melbourne’s South East the only precinct to record higher face rental growth. Prime incentives increased in most markets along the East Coast, leading to softer rental growth outcomes on a net effective basis.

Just over 1 million sqm of industrial supply was delivered during the quarter, representing the second biggest quarter of completions behind Q2 2022. Activity was heavily concentrated in Melbourne, which accounted for 55% of supply nationally with four of the five largest projects. A further 1.8 million sqm of supply is currently under construction and slated for delivery in 2024. However, more than half of this floorspace is scheduled for completion in the last quarter of the year and hence is at risk of slipping into 2025 given ongoing project delays. While extended delivery schedules and solid pre-commitment levels are helping prevent a flood of unleased supply from entering the market, elevated completions relative to demand are likely to see the vacancy rate – and rental growth – trend towards the long-run average.

There was further improvement in transaction activity this quarter with dollar volume increasing to $3.2 billion, the highest quarterly level seen since Q4 2021 and the strongest result outside of that record year. The portfolio sale of 12 Goodman assets across Sydney and Melbourne, jointly acquired by Barings and Rest, was the main transaction. Capital continues to be attracted to Sydney, which accounted for 53% of transaction volume (excluding multi-market portfolio deals). Yields were largely unchanged over the quarter, with 25bps of expansion in Sydney North and Brisbane Trade Coast the only notable movements.

If rates are held steady, the labour market continues to soften, and disinflation resumes its downwards trend, we should see further improvement in capital market liquidity and property transaction activity.


Outlook

The RBA meeting on 6 August is the key event of the September quarter. The decision to hike or hold rates will be dependent on June quarter inflation (released 31 July) and June labour data (released 18 July). While there is a case for monetary policy to be more restrictive, the RBA has adopted the position that preserving employment gains is a key priority and so the threshold for a hike is high.
If rates are held steady, the labour market continues to soften, and disinflation resumes its downwards trend, we should see further improvement in capital market liquidity and property transaction activity. While there are risks to the outlook such as shipping disruptions, volatile election outcomes, and conflict escalation, the Australian economy appears to still be on the narrow path towards a soft landing.

How did the Cromwell Funds Management fare this quarter?

In April, approximately 25% of the Cromwell Direct Property Fund (DPF) portfolio was revalued, with another 17% in May and 52% in June. Eight of the fund’s nine assets have now been independently revalued. Overall, from December last year, capitalisation rates have softened by 30bps to a weighted average of 7.18%, equating to a 3% fall across the portfolio, which is now valued at $607 million.

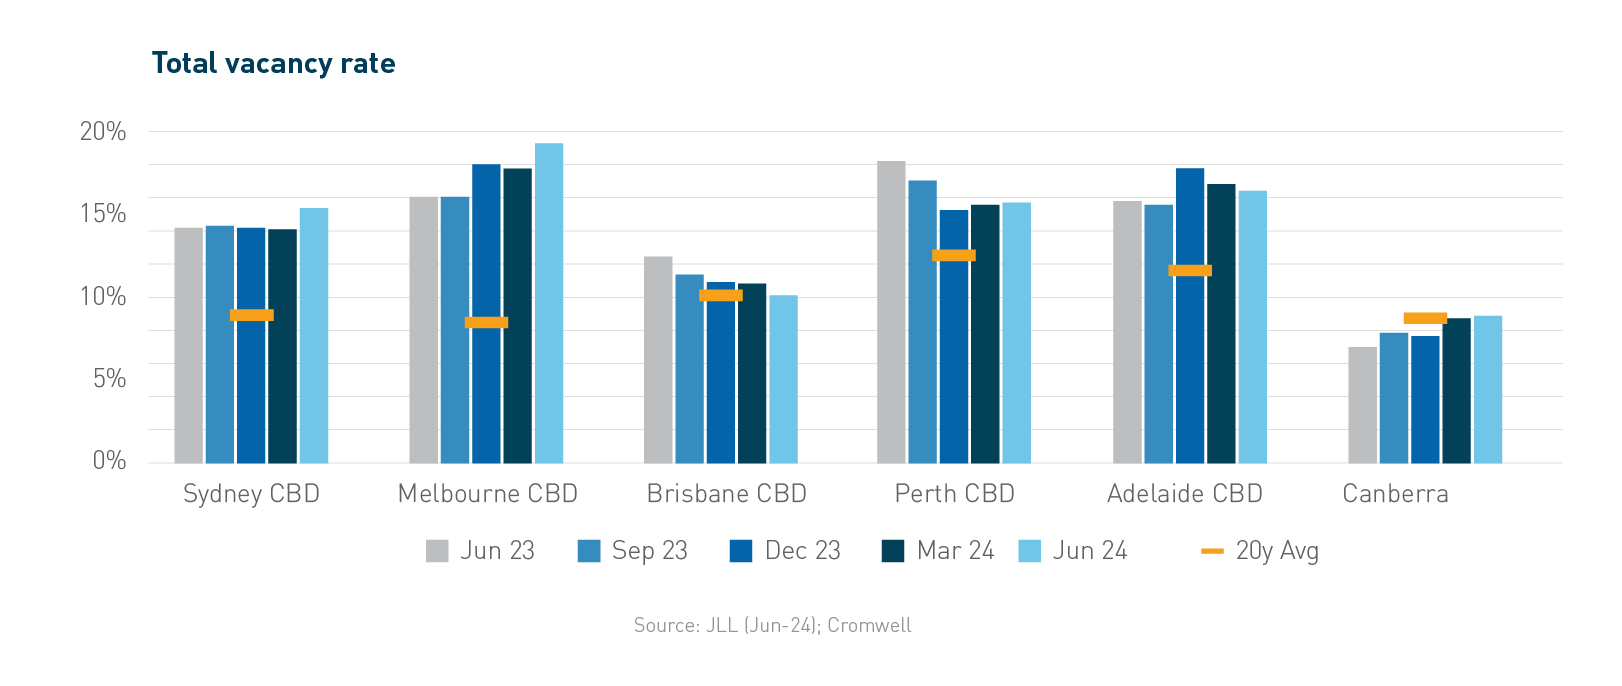
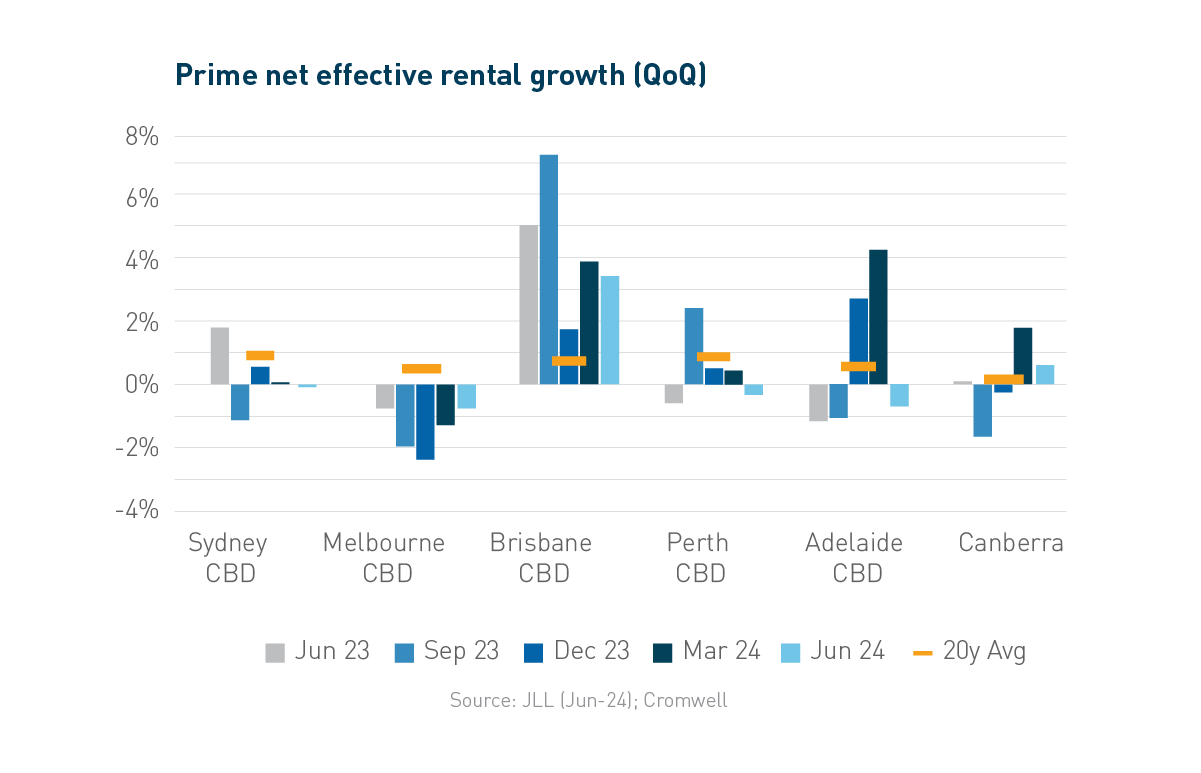
The Brisbane office market, where just under 55% of DPF’s portfolio is held, is experiencing strong fundamentals. This is evidenced by positive net absorption, a decrease in headline vacancy and positive net effective rental growth of 3.4% for the quarter, and 14% over the past 12 months. As noted in the market update above, Brisbane is leading the country for rental growth and is currently one of the strongest-performing leasing markets in the APAC region.

High construction costs and upward pressure on labour, helped along by Queensland’s significant infrastructure pipeline over the next 3-4 years, will see supply constrained for some time, which bodes well for leasing demand and future rental growth on existing assets. Additionally, the anticipated rapid increase in immigration is likely to further drive demand for commercial office space, as well as in the medical, retail, and industrial sectors.

While Cromwell is optimistic that valuations have experienced the worst of the cycle and will now stabilise, it is pertinent to note that recent CPI prints and the Reserve Bank of Australia’s neutral stance on rates may delay this stabilisation. In the interim, Cromwell’s key focus remains on maximizing portfolio performance to help ensure the delivery of regular distributions.

Portfolio updates for the quarter
Cromwell is continuously exploring ways to enhance the tenant experience and improve the amenities offered within its buildings. The implementation of a tenant portal, Cromwell Connect, is currently underway across several of our assets. This portal will enable tenants to access various forms of data, make bookings for communal training or meeting rooms and interact with retailers for services such as ordering coffees, booking dry cleaning, and reserving Pilates classes.

Cromwell Property Trust 12’s (C12) Dandenong asset recently underwent balcony refurbishment works, including the replacement of artificial turf with tiling. Additionally, 100 Creek Street in the Brisbane CBD is undergoing a comprehensive lift modernisation, which includes the upgrade of lift motors, with a heating upgrade project scheduled for later this financial year.

The solar works at Dandenong, Mascot, and Townsville assets have now been completed and energized, resulting in seven of the nine DPF assets benefiting from solar power.

The portfolio experienced strong leasing performance for the quarter, with six deals signed at 100 Creek Street, four of which were completed using existing spec fitouts. The other two were renewals on just under 1,300 sqm. Furthermore, one of the largest tenants at Queen Street exercised a 2-year option over almost 1,500 sqm, and at Mascot, a 5-year renewal with a tenant secured in 2023 was recently completed, occupying just under 1,300 sqm. Cromwell is also receiving good levels of enquiry over a couple of full-floor vacancies in Brisbane and Adelaide.

The portfolio currently maintains a 95.5% occupancy rate, with a weighted average lease expiry of 4 years.

Cromwell’s asset management and projects teams remain hard at work to maximise occupancy across the portfolio, whether by renewing current tenants or relocating them within the buildings using existing fitouts. This approach allows the cost of incentives to be spread across the lease term rather than funded upfront. Moreover, Cromwell is dedicated to maximising energy efficiency and maintaining and improving NABERS ratings through carefully planned lifecycle programmes aligned with decarbonisation plans and ESG initiatives. In April, 545 Queen Street was awarded a 6.0-star NABERS Energy rating for the first time, an improvement from its 5.5 stars. This achievement was the result of years of sustainability planning, energy-saving initiatives, and ongoing consultation with Australian energy solutions provider, Conservia.

Cromwell is pleased to be progressing on its net zero pathway, having already achieved a 73% reduction in emissions across the DPF portfolio3.

Read more about the Cromwell Direct Property Fund: www.cromwell.com.au/dpf.

Past performance is not a reliable indicator of future performance.

Cromwell Funds Management Limited ACN 114 782 777 is the responsible entity of and issuer of units in the Cromwell Direct Property Fund ARSN 165 011 905.

Before making an investment decision in relation to the Fund it is important that you read and consider the Product Disclosure Statement and Target Market Determination available from www.cromwell.com.au/dpf, by calling 1300 268 078 or emailing invest@cromwell.com.au.


  1. Except for the Tasmanian Budget which has been delayed from May to September.
  2. Consumer Sentiment (Westpac-Melbourne Institute, May-24)
  3. This excludes Queen Street in Brisbane which is undertaking a decarbonisation audit in FY25
About Cromwell Direct Property Fund

Read more about Cromwell Direct Property Fund, including where to locate the product disclosure statement (PDS) and target market determination (TMD). Investors should consider the PDS and TMD in deciding whether to acquire, or to continue to hold units in the Fund.