March 2024 direct property market update - Cromwell Funds Management
Person typing on a laptop

Learn

Home March 2024 direct property market update
April 22, 2024

March 2024 direct property market update

Economy

The disinflation cycle is in the ‘last mile’, where monetary policy is being finely calibrated and market expectations can move month-to-month with each new data release. This was reflected in the RBA’s stance at the March Board meeting, where Australia’s central bank arguably kept a foot in both the tightening and neutral camps. However, much of the market’s speculation is focused on when rate cuts will occur, rather than the genuine possibility of further hikes. As at the end of March, financial markets and the major banks were forecasting the first cut to occur in the final quarter of 2024.

Annual inflation was stable at 3.4% in February (data released March), with rent and insurance inflation remaining stubbornly high, and goods inflation continuing to be moderate. However it is the tightness of the labour market (services inflation) which will likely be the key determinant of the CPI path moving forward. On this front, the unemployment rate fell from 4.1% in January to 3.7% in February1. The magnitude of the decrease is surprising at first glance, but less unexpected when you look at the detailed data which shows a shift in the seasonality of the labour market. It is now becoming the ‘new norm’ for workers to end a job in December and not start a new one until February. Labour data has also shown more volatility month-to-month since the pandemic. Looking at the recent trend rather than the latest monthly print in isolation shows the labour market is gradually softening, with underemployment (people wanting more hours) at its highest level since December 2021 and leading indicators such as job vacancies falling (albeit from high levels).


Retail sales provide another indication of a slowing economy. While Taylor Swift’s recent tour boosted February spending on clothing, department stores and dining in New South Wales and Victoria (the locations of the concerts), annual nominal growth of only 1.6% was recorded2. Considering inflation is running above 3% and population growth of circa 2.5%, underlying consumption is very weak, showing that the cost of living is clearly biting. However, consensus expectations are that there should be some relief towards the end of the year as stage 3 tax cuts flow through, inflation continues to moderate, and interest rates potentially ease.

A part of the economy bucking the slowdown trend is housing; reflecting robust demand and constrained supply. CoreLogic’s national Home Value Index recorded its 14th consecutive month of growth in March, rising to new record highs each month since November 20233. There is a risk sustained house price growth may influence the RBA’s view of the appropriate rate path, however as previously stated, the health of the labour market will likely be a much greater focus.

Office

The office market recorded a positive result in the March quarter. According to JLL Research, national CBD net absorption totalled just over +33,000 square metres (sqm), the strongest result since March 2023. Sydney was the top-performing market after three weak quarters prior, while Perth was the only major CBD market which saw demand decline as a result of softening in the non-Premium grades. On an annual basis, net demand is still strongest in the smaller markets of Adelaide, Brisbane, and Perth.


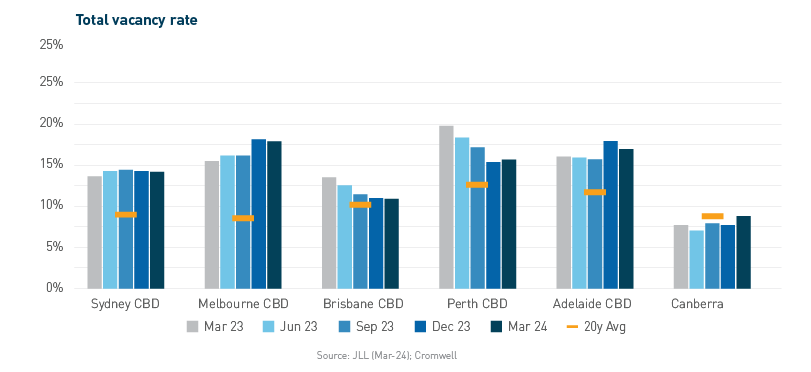
The national CBD vacancy rate was flat at 14.7%, with every CBD market except Perth and Canberra recording an improvement in supply-demand conditions. While the softening in Perth was due to both new supply and weaker demand, the increase in Canberra vacancy was entirely driven by the addition of new stock (completion of a refurbishment). Nationally, Premium assets saw the greatest improvement in vacancy rate.

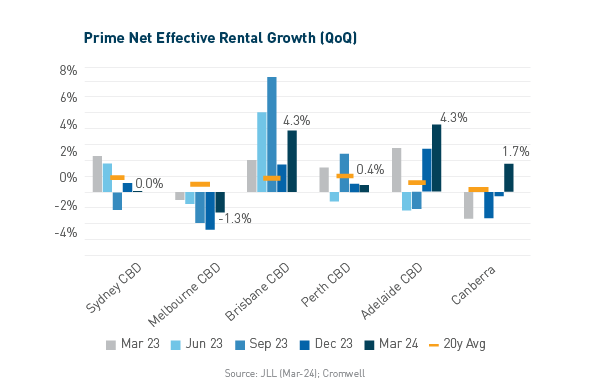
Prime net face rent growth (+1.4%) accelerated further compared to the prior quarter (+0.9%), with the Brisbane CBD and Adelaide CBD the top performers. Prime incentives were largely flat (+0.1%), with half of the markets recording minor increases (Sydney, Melbourne, Perth), offset by the other half recording minor improvements. This meant on a net effective basis, Adelaide and Brisbane recorded the strongest growth, with Melbourne the only market to head backwards.


Reflecting the continued softness in conditions, transaction volume for the March quarter ($1.0 billion nationally) was roughly in line with the quarterly average over the prior 12 months but 64% lower than the Q1 average of the previous five years. Having said that, it was the highest number of sales seen since December 2022, highlighting that the smaller end of the market remains more active than larger lot sizes. The lack of transaction activity reflects the sharp increase in cost of capital seen over the past 24 months. This has resulted in national CBD prime average yields softening a further 29bps over the quarter. The national movement in yields may not be directly reflective of individual portfolios or assets, given differences in the timing of valuation processes.

Retail

While annual rental growth remains soft, it is consistent and broad-based. According to JLL Research, across large discretionary shopping centres (Regionals) gross rental growth averaged +0.1% for the quarter and +0.5% for the year, with every market recording a similar result. Growth across Sub-Regionals was slightly stronger at +0.2% and +0.8%, representing nine consecutive quarters of rental increases. Neighbourhood centres also recorded growth of +0.2% for the quarter, taking annual growth to +0.6%. Sydney and South-East Queensland, which have the highest Neighbourhood rents per sqm, recorded slightly weaker growth than the other markets.

It was a very slow quarter for retail property transactions, with volume totalling just over $500 million. No Regional assets changed hands for the first time since September 2022, dragging the dollar value of activity lower. It was quiet across the other centre types as well, with Sub-Regionals the most active relative to the five-year average. While yields did expand further over the quarter, it was to a lesser extent than office and industrial reflecting the higher starting point of retail yields prior to the hiking cycle.

While yields did expand further over the quarter, it was to a lesser extent than office and industrial reflecting the higher starting point of retail yields prior to the hiking cycle.

Industrial

Gross occupier take-up softened materially over the quarter as inventory levels contracted and the broader economy slowed. Transport and Warehousing continues to comprise the greatest share of demand from an industry perspective, with Manufacturing take-up also remaining at a solid level. The big driver of the slowdown was Retail and Wholesale Trade, which saw demand fall by around 90% compared to the five-year average. This may reflect cautiousness from occupiers in the face of weak retail sales and declining global trade volumes, together with a ‘pause’ to expansion after substantial take-up during the pandemic. From a market perspective, Sydney saw the largest slowdown in demand, with South-East Queensland and Perth holding up well.


While rental growth is slowing from record highs, it remains well above trend, consistent with tight vacancy conditions. Melbourne saw the strongest growth, with Melbourne West the top-performing precinct nationally (+8.0% QoQ). Brisbane growth was robust in the infill Trade Coast precinct, while the land constrained South precinct was the top performer in Sydney. Rental growth in Sydney’s Outer Central West, where land is more abundant, was not as strong.

Almost 500,000sqm of industrial supply was completed in the first quarter of 2024. A further two million sqm4 of supply is slated for completion over the balance of the year, however construction delays may see timings slip. If all the projected supply is completed in 2024, it would represent the second highest level of completions in a calendar year behind 2022 (2.7m sqm). Projects are heavily concentrated in the land-rich, outer precincts, with 66% of expected 2024 supply to occur in just four precincts (of 22 nationally). Ongoing elevated levels of supply will likely lead to greater availability of space and a further softening of rental growth.

There was a rebound in transaction activity over the quarter, with dollar volumes exceeding the five-year average and hitting the highest level since September 2022. Activity was dominated by Sydney, in particular ISPT and Unisuper’s joint acquisition of a 280 hectare greenfield development site in Badgerys Creek. Consistent with other sectors, prime industrial yields expanded over the quarter along the East Coast, with the smaller markets of Adelaide and Perth unchanged. Sydney saw the greatest degree of softening, but still has the tightest yields nationally.


Outlook

The global economy is slowing but at a relatively measured pace, engendering optimism that a “soft landing” can be achieved. Australia’s economy is in a similar position, with inflation slowing but employment conditions remaining resilient. Markets are becoming more confident the rate hiking cycle is at or near its end, which should help ease uncertainty and improve liquidity for property later in the year.

While an economic slowdown is expected over 2024 and early 2025, a more significant contraction (i.e. recession) is looking less likely. Businesses will continue to review their space requirements as they adjust to hybrid working, though the balance between in-office versus remote is expected to shift back towards the office over 2024. Location continues to be an important driver of occupier preferences, combined with amenity and building quality (at a given price point).

How did the Cromwell Funds Management fare this quarter?

With the Cromwell Direct Property Fund’s property portfolio completely revalued externally in November and December 2023, no external revaluations were completed in the March quarter. With the revaluation process and half-year accounts released, the Fund recommenced accepting applications and offering the Distribution Reinvestment Plan (at a 5% discount) from 25 March 2024.

The Fund continues to experience positive leasing outcomes, especially in its Brisbane based assets. The strategy to build quality speculative fitouts and improving amenity with 3rd spaces has helped improve occupancy metrics, tenant engagement, and improving rental growth.

Both the Cromwell Riverpark Trust’s Energex asset (CRT) and Cromwell Trust 12’s Dandenong asset (C12) had solar panels installed. The installation is awaiting grid approval, and the work will help maintain (for CRT) and obtain (for C12) a 6-star NABERS rating.

Read more about the Cromwell Direct Property Fund: www.cromwell.com.au/dpf.

Past performance is not a reliable indicator of future performance.

Cromwell Funds Management Limited ACN 114 782 777 is the responsible entity of and issuer of units in the Cromwell Direct Property Fund ARSN 165 011 905.

Before making an investment decision in relation to the Fund it is important that you read and consider the Product Disclosure Statement and Target Market Determination available from www.cromwell.com.au/dpf, by calling 1300 268 078 or emailing invest@cromwell.com.au.


  1. Labour Force, ABS
  2. Retail Trade, ABS
  3. Hedonic Home Value Index, CoreLogic
  4. Projects with a status of Under Construction, Plans Approved, or Plans Submitted
About Cromwell Direct Property Fund

Read more about Cromwell Direct Property Fund, including where to locate the product disclosure statement (PDS) and target market determination (TMD). Investors should consider the PDS and TMD in deciding whether to acquire, or to continue to hold units in the Fund.