34079
Person typing on a laptop

Learn

Home March 2025 direct property market update
April 24, 2025

March 2025 direct property market update

Economy1

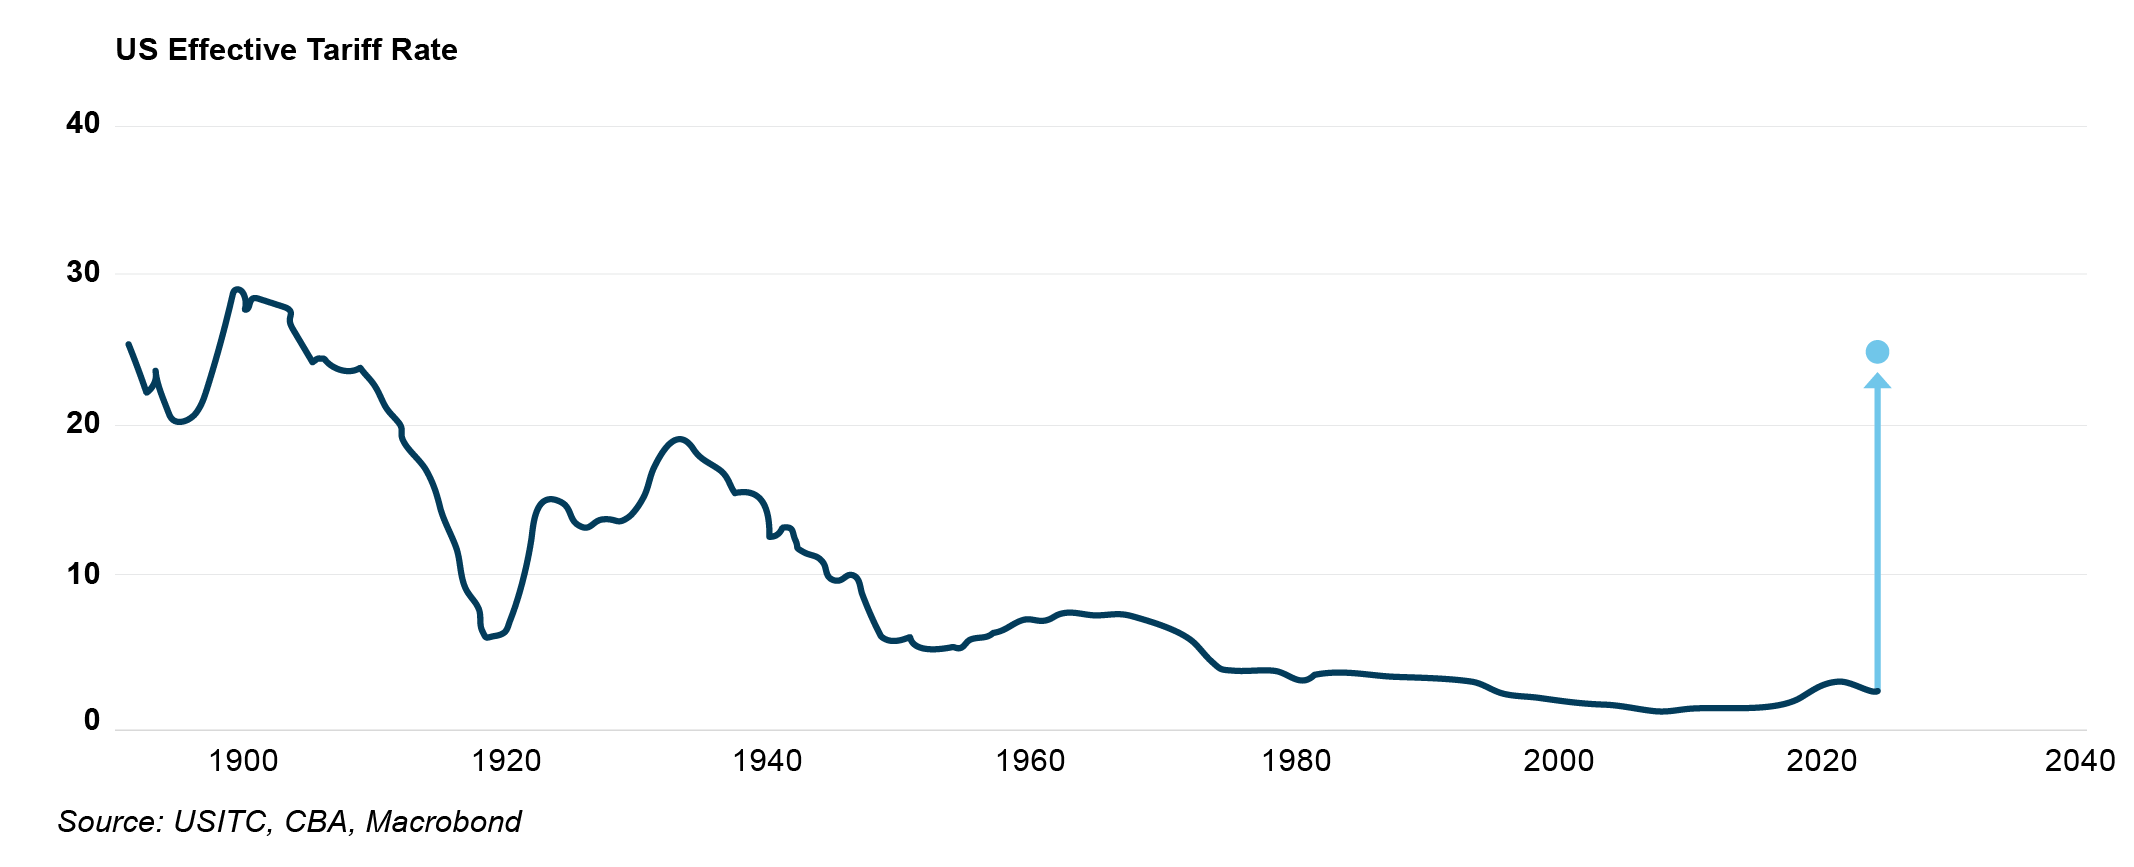
Events of the March quarter have been completely overshadowed by President Trump’s Rose Garden address on 2 April where he announced a universal 10% tariff would be applied to all US imports from 5 April, with higher tariffs to be applied from 9 April against countries with trade surpluses with the US. Taking the measures as announced, the US’s effective tariff rate is expected to increase to around 25%, a level last seen in the early 1900s2.


In the near-term, a key impact to markets and the economy is heightened volatility and uncertainty. Indeed, product exemptions and a 90-day pause on the higher tariff rates (excluding China) have already been announced. While one of Trump’s stated objectives is to incentivise investment into US manufacturing, it will be challenging for companies to commit substantial capital and resources when the landscape could shift significantly by the time these words go to print, let alone the several years which would be required to reorganise supply chains and build facilities.

Equity and bond markets have seesawed as the prospect of stagflation – higher inflation and lower growth – shakes confidence. Positively for Australia, we’re better positioned than most to weather the storm. On the whole, direct trade impacts should be limited given the US only accounts for 4% of Australian exports3. Indirect impacts via a weaker Asian economy are a risk, and the extent of policy support in China will be closely watched. The floating Australian dollar is acting as a shock absorber, depreciating in value and enhancing the attractiveness of our key commodity exports.

Economic conditions at home are also in good shape. The labour market is healthy without being so tight as to cause inflationary wage pressures, the public sector is in a position to provide supportive spending if needed, and the RBA has scope to stimulate the economy via monetary policy. In February, the RBA made its long-awaited first interest rate cut, reducing the official cash rate to 4.1%. Looking ahead, National Australia Bank (NAB) expects further easing, forecasting a 50bps cut in May, followed by 25bps reductions in July, August, and November—potentially taking the cash rate to 2.85% by year-end. Other major banks predict a slightly slower pace, but all anticipate a more supportive interest rate environment, which bodes well for increased transactional activity and continued market recovery.


Looking ahead, National Australia Bank (NAB) expects further easing, forecasting a 50bps cut in May, followed by 25bps reductions in July, August, and November—potentially taking the cash rate to 2.85% by year-end.


Office

Analysis of JLL Research data indicates nearly 44,000 square metres (sqm) of positive net absorption was recorded across Australia’s major CBD markets in Q1 2025, marking the fifth consecutive quarter of space demand growth. The composition of demand was different from previous quarters, with Brisbane CBD the only market to contract and Melbourne CBD the top performer. This was the first time since early 2019 that Melbourne recorded the strongest growth in net demand, with the result underpinned by Coles’ 30,000 sqm centralisation from Hawthorn East into Docklands. Notably, this quarter also saw the largest gap in space demand between large4 and small occupiers nationally since before the pandemic, with large occupiers leading the way. Again, this was underpinned by leasing activity in Melbourne CBD.


The positive demand result and limited supply completions combined to lower the national CBD vacancy rate from 15.2% to 14.9%. Melbourne CBD was the big winner, with vacancy tightening by 1.2%pts. Sydney CBD vacancy also decreased, with every precinct except the Western Corridor tightening. Softer demand over the quarter led to Brisbane CBD’s vacancy rate rising, however it remains lower than the long-term average. The increase in Brisbane was driven entirely by Secondary grade stock – Prime vacancy remained at 7.3% and is below the long-term average, while Secondary vacancy increased by 0.8%pts. Canberra maintained its position as the tightest market in the country, however the vacancy rate did increase due to the completion of a new A grade development.

National CBD prime net face rent growth (+1.9%) accelerated over the quarter, taking annual growth to +5.6% which is its strongest pace since early 2018. While face rents in Perth and Adelaide were unchanged, all of the other CBD markets recorded quarterly growth well in excess of the long-term average. Prime incentives decreased in the Sydney CBD Core as some Premium assets recorded strong leasing outcomes. As a result, Sydney CBD Core delivered its strongest net effective rental growth since 2017 and the best outcome across the major CBDs. Incentives also declined slightly in Brisbane CBD, ensuring effective rental growth stayed in double-digit territory on an annual basis. Elevated vacancy in Melbourne CBD continued to put upwards pressure on incentives, dragging effective rental levels lower.


Transaction volume fell to $1.4 billion after a solid final quarter of 2024. Sydney CBD maintained its position as the top preference for capital, accounting for 73% of activity. Offshore capital was active again, with Japanese investor Daibiru making the largest acquisition of the quarter (135 King St). The trajectory of deal flow in Sydney will be watched closely over coming quarters, given it tends to act as a bellwether for the capital market cycle. Activity in Melbourne was very muted, weighed down by weaker property fundamentals and associated investor cautiousness. Average prime yields were unchanged across every CBD market and most non-CBD markets.

Array
(
    [slides] => Array
        (
            [0] => Array
                (
                    [media_type] => image
                    [image] => Array
                        (
                            [image] => Array
                                (
                                    [ID] => 34255
                                    [id] => 34255
                                    [title] => Skyline of Melbourne
                                    [filename] => iStock-1964152247.jpg
                                    [filesize] => 2801808
                                    [url] => https://www.cromwell.com.au/wp-content/uploads/sites/2/2025/04/iStock-1964152247.jpg
                                    [link] => https://www.cromwell.com.au/march-2025-direct-property-market-update/skyline-of-melbourne/
                                    [alt] => 
                                    [author] => 39
                                    [description] => 
                                     => Skyline of Melbourne from 88th floor
                                    [name] => skyline-of-melbourne
                                    [status] => inherit
                                    [uploaded_to] => 34079
                                    [date] => 2025-04-22 23:37:00
                                    [modified] => 2025-04-22 23:37:00
                                    [menu_order] => 0
                                    [mime_type] => image/jpeg
                                    [type] => image
                                    [subtype] => jpeg
                                    [icon] => https://www.cromwell.com.au/wp-includes/images/media/default.png
                                    [width] => 1024
                                    [height] => 576
                                    [sizes] => Array
                                        (
                                        )

                                )

                            [alternate_images] => 
                            [mobile_image] => 
                            [tablet_image] => 
                        )

                     => Array
                        (
                            [video_type] => file
                            [autoplay] => 
                            [video_file] => 
                            [video_embed] => 
                            [image_placeholder] => Array
                                (
                                    [image] => Array
                                        (
                                            [image] => 
                                            [alternate_images] => 
                                            [mobile_image] => 
                                            [tablet_image] => 
                                        )

                                )

                        )

                    [title_block] => Array
                        (
                            [title] => 
                            [emphasise_title] => 
                            [emphasised_text] => real foundations.
                            [emphasis_style] => script
                            [content] => 
                        )

                    [text_width] => constrained
                    [button_group] => Array
                        (
                            [buttons] => 
                        )

                )

        )

    [banner_placement] => inner
    [media_position] => full
    [content_alignment] => left
    [block_theme] => Array
        (
            [block_theme] => Array
                (
                    [] => 
                    [background_colour] => theme-white
                    [block_padding] => section-padding-large
                    [add_anchor_id] => 
                    [anchor_id] => 
                )

        )

)

Retail

Retail sales growth has improved from the lows of 2023-24 but is yet to kick up materially. The tailwinds of moderating inflation, lower interest rates, and government cost-of-living supports are competing against a pessimistic and cautious consumer. While confidence was improving through the first quarter of the year, tariff uncertainty has now dampened sentiment.


Amidst stable demand, supply remains very constrained. There were only 13,000 sqm added to national core retail stock over the quarter, comprising two greenfield Neighbourhood centres servicing new housing estates. Muted supply has supported retail space market fundamentals and rental growth over the past year. While rents were largely unchanged across Regional and Sub-Regional centres this quarter, Neighbourhood centres recorded solid growth of 0.4% led by Sydney and Perth.

While retail transaction volume fell compared to last quarter, the $1.6 billion of deals done represented the second-strongest March quarter result in the history of the data series (back to 2007). The strong outcome was largely driven by large format retail and Regionals, with solid support from Sub-Regionals. Centuria’s acquisition of Logan SuperCentre ($115 million) was the dominant large format trade, while Northland Shopping Centre and Cockburn Gateway comprised the Regional deals. Northland was notable in being Victoria’s largest retail transaction since 2018.

This quarter provided further evidence that the cycle has started to turn for the retail sector. Regional shopping centre yields compressed in every market, while Sub-Regional yields compressed in every market bar Sydney.

Array
(
    [slides] => Array
        (
            [0] => Array
                (
                    [media_type] => image
                    [image] => Array
                        (
                            [image] => Array
                                (
                                    [ID] => 34256
                                    [id] => 34256
                                    [title] => Crowd of People enjoying sunny day in city mall, background with copy space
                                    [filename] => iStock-1499348973-e1745369375525.jpg
                                    [filesize] => 1244327
                                    [url] => https://www.cromwell.com.au/wp-content/uploads/sites/2/2025/04/iStock-1499348973-e1745369375525.jpg
                                    [link] => https://www.cromwell.com.au/march-2025-direct-property-market-update/crowd-of-people-enjoying-sunny-day-in-city-mall-background-with-copy-space/
                                    [alt] => 
                                    [author] => 39
                                    [description] => 
                                     => Crowd of People walking and enjoying sunny day in Pitt Street mall, Sydney Australia, full frame horizontal composition
                                    [name] => crowd-of-people-enjoying-sunny-day-in-city-mall-background-with-copy-space
                                    [status] => inherit
                                    [uploaded_to] => 34079
                                    [date] => 2025-04-22 23:37:06
                                    [modified] => 2025-04-22 23:37:06
                                    [menu_order] => 0
                                    [mime_type] => image/jpeg
                                    [type] => image
                                    [subtype] => jpeg
                                    [icon] => https://www.cromwell.com.au/wp-includes/images/media/default.png
                                    [width] => 1024
                                    [height] => 451
                                    [sizes] => Array
                                        (
                                        )

                                )

                            [alternate_images] => 
                            [mobile_image] => 
                            [tablet_image] => 
                        )

                     => Array
                        (
                            [video_type] => file
                            [autoplay] => 
                            [video_file] => 
                            [video_embed] => 
                            [image_placeholder] => Array
                                (
                                    [image] => Array
                                        (
                                            [image] => 
                                            [alternate_images] => 
                                            [mobile_image] => 
                                            [tablet_image] => 
                                        )

                                )

                        )

                    [title_block] => Array
                        (
                            [title] => 
                            [emphasise_title] => 
                            [emphasised_text] => real foundations.
                            [emphasis_style] => script
                            [content] => 
                        )

                    [text_width] => constrained
                    [button_group] => Array
                        (
                            [buttons] => 
                        )

                )

        )

    [banner_placement] => inner
    [media_position] => full
    [content_alignment] => left
    [block_theme] => Array
        (
            [block_theme] => Array
                (
                    [] => 
                    [background_colour] => theme-white
                    [block_padding] => section-padding-large
                    [add_anchor_id] => 
                    [anchor_id] => 
                )

        )

)

Industrial

Occupier take-up (gross demand) continued to hold up, totalling just under 800k sqm which was the strongest March quarter in three years. While Transport, Postal & Warehousing, Manufacturing, and Retail & Wholesale Trade remained the top three industries from a demand perspective, it was the smaller and more volatile industries such as Professional Services, Mining, and Construction which experienced the strongest increase in demand relative to historical levels. Sydney recorded the highest level of gross space demand, headlined by Aldi’s pre-lease of an 87,000 sqm cold storage facility which is due to complete in 2027. The precinct this site is located in, Sydney Outer Central West, accounted for 37% of national demand and 86% of Sydney demand over the quarter.


Rent growth remains above the long-term average despite a weakening of demand relative to supply. Growth was more broad-based than last quarter, with face rents increasing in 17 of 22 precincts. The smaller markets of Adelaide and Perth recorded the strongest rental growth over the quarter, with Adelaide providing all of the top three precincts. Prime incentives continued to nudge higher across the east coast and Perth, reflecting a more competitive leasing environment.

Supply completions over the quarter were concentrated in Melbourne, as has generally been the case over the past five years. The West precinct was again the main provider of new space, however Melbourne South East was not far behind. It was a particularly muted quarter for development in Sydney, with only 43k sqm reaching completion versus the five-year quarterly average of more than 170k sqm. While a substantial pipeline of 1.5 million sqm remains under construction and due to complete in 2025, actual supply delivered may prove to be spread out over a longer horizon given projects continue to be delayed.

Industrial transaction volume fell below the quarterly average of the last five years as no major portfolio deals occurred. While Sydney accounted for the largest share of transactions by dollar value, Brisbane was the most active market compared to its historical average. Despite a relatively quiet quarter of dealmaking, there are signs the valuation cycle is starting to turn for industrial. Sydney, the bellwether market, recorded yield compression across most precincts.

Outlook

Where the global economy lands as a result of trade protectionism will depend on the duration barriers are in place, the extent of any retaliatory measures, and outcomes of trade negotiations. The situation is shifting on a daily basis, and the resultant uncertainty is having a dampening effect on economic activity.

While Australia is less exposed to the economic consequences than many other countries, there is a risk that growth weakens, and this could soften leasing demand in the near-term as companies take a cautious approach to investment and expansion. In this kind of environment, high-quality assets providing stable income from blue chip, resilient tenants are desirable.

Increased uncertainty may also affect liquidity in commercial property capital markets. Positively, Australia’s standing as a stable and reliable investment destination offering attractive returns has arguably been enhanced over the past month, and this could support acquisition activity from offshore capital. During this period of heightened volatility, focusing on underlying property fundamentals and sticking to a long-term strategy should hold investors in good stead.

Cromwell Direct Property Fund – March 2025 Quarterly Update

Below is the latest quarterly update for the Cromwell Direct Property Fund (the Fund), where we share key developments, portfolio performance, and what’s coming up in the months ahead.

Upcoming Liquidity Event – Periodic Withdrawal Opportunity

The Fund’s next Liquidity Event—its Periodic Withdrawal Opportunity—is scheduled to commence in July 2025. Investors will receive an information pack in May, which will include market commentary and helpful insights to support your decision on whether to redeem some or all of your investment or remain invested as the market enters the recovery phase.

The Liquidity Event is designed to occur every five years, although the timing can be adjusted under certain circumstances. Under the current indicative timetable, investors will be able to submit withdrawal requests between 1 July and 5pm (AEST) on 31 July 2025. Requests must be submitted to our registry provider, Boardroom Limited, using the specific form included in your information pack and available on the Fund’s webpages.

Redemptions will be processed in accordance with the Fund’s rules and may be funded through a mix of new capital, debt (subject to gearing limits), and potential asset sales. Depending on the number of requests received, and the liquidity available to the Fund from those sources, withdrawals may be paid in instalments over time, rather than as a single lump sum.

Full details will be provided in the information pack. If you have any questions about the Liquidity Event or would like to discuss your options, our Investor Services Team is here to assist.

Portfolio performance

The Fund’s portfolio continues to perform strongly, with occupancy at 96.5% and a weighted average lease expiry (WALE) of 3.6 years.

Our expert in-house Facilities Management team demonstrated exceptional responsiveness in early March as Cyclone Alfred approached South-East Queensland. Although downgraded to an ex-tropical cyclone by landfall, the storm caused damage to glazing at the 545 Queen Street building in Brisbane due to airborne debris. Emergency safety works were completed within days, with repairs managed efficiently in collaboration with specialist consultants and insurers.

Tenant engagement and Environmental, Social, and Governance (ESG) initiatives

Cromwell Funds Management continues to prioritise tenant engagement and ESG performance across the Fund’s assets. A variety of tenant-focused initiatives were delivered this quarter, including Welcome Back to Work, Valentine’s Day activations, International Women’s Day, the Share the Dignity drive, and Earth Hour. These events enhance tenant satisfaction and support strong lease renewals in a competitive market.

There were also several ESG milestones achieved:

  • Flinders Street, Townsville received its first 6-star NABERS Energy rating, a 5.5-star Water rating, and increased its Renewable Energy Indicator to 99.3%, thanks to its use of 100% green power since January last year.
  • Solar installations across multiple assets have led to reductions in base building electricity consumption by up to 27% over the past 6–9 months.
  • Results from the latest tenant survey showed that 61% of respondents consider ESG factors important or very important in their leasing decisions.

Recent building enhancement

A major upgrade to the heating system at 100 Creek Street, Brisbane, was completed during the quarter. This project included the installation of electric duct heaters, mechanical switchboards, and an upgrade to the Building Management System (BMS), ensuring a comfortable environment for tenants during the winter months. The works were delivered with minimal disruption and came in just under budget—a testament to the expertise of our Projects Team.


Footnotes

  1. Data sourced from various ABS publications, except where otherwise specified
  2. CBA, 9 April 2025
  3. NAB, 2 April 2025
  4. Large occupiers are those greater than 1,000 sqm
About Cromwell Direct Property Fund

Read more about Cromwell Direct Property Fund, including where to locate the product disclosure statement (PDS) and target market determination (TMD). Investors should consider the PDS and TMD in deciding whether to acquire, or to continue to hold units in the Fund.